Hello,i want to generate a sort of particle with a uniform distribution ,which energy is from 0-30MeV.
Here is my code,but the resuilt seems not right.Some energy didn’t appeared like 2MeV,3MeV etc.
Can you check my code and give some advice?
Don’t use rand(). Use G4UniformRand(), which returns a floating point value between 0 and 1. Geant4 includes much better random engines and the Unix system does.
Your expression is only multiplying a by your units; the random value isn’t being multiplied. So there’s no guarantee the final value is physically meaningful.
Don’t use integers. Energy is a floating point value.
Specify your enengy range with energy units, then do a simple calculation.
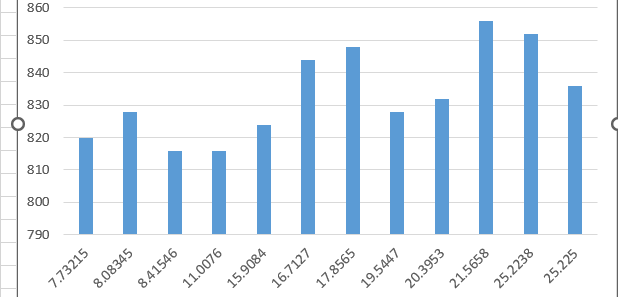
ok,here’s the histo.X is the energy value which created.and you see the problem.Just some value .
And plus,I run 100 times and emit 100 particles each run.
I thick maybe some wrong configuration about random value .
So what is the mean and RMS of the number of entries for that particular binning? With 12 bins, you should have an average of 833 entries per bin. That’s what it looks like to me. Maybe make a plot of the number of entries per bin, see what that looks like?
You could do a sophisticated test, like a Kolomogorov-Smirnov comparison to a flat distribution, and see what P value comes out. I think you’re going to find that you’re getting exactly what you should, with normal statistical fluctuations.
There aren’t “12 values created.” You chose to create a histogram with only 12 bins. Therefore, there are only 12 bins filled with the full distribution of floating point values.
Why don’t you create a histogram with 8 bins, or 200 bins, or something else?