Hello Geant4 users,
I have a time consuming application that I would like to run in MT over my 48 threads machine (2processors → 212 cores → 2*24 Threads). I am working on Windows 10 with geant4 10_06_p02 installed. My processors are Processor Intel® Xeon® Gold 5118. When I ask ”G4Threading::G4GetNumberOfCores()“ I get 48.
I first set DGEANT4_BUILD_MULTITHREADED=ON during Geant4 installation. Then I tested some provided applications examples using different number of threads ”runManager->SetNumberOfThreads(x)“ and I measured simulation time elapsed.
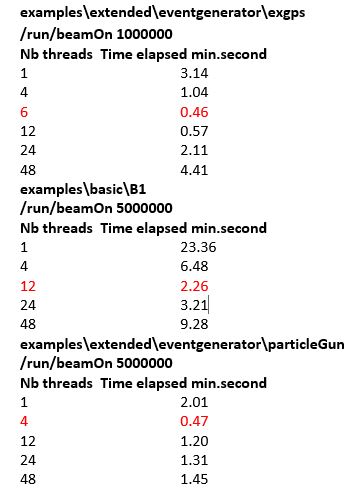
I realized that simulation time does not decrease necessary with the number of threads in my case. I supposed applications run over 1 processor but some unknowns remains:
-Why is 24 threads setting not faster than others?
-What is the difference between Parallelization and Multithreading?
I understand that there are specific libraries and technics which are “examples\extended\parallel” but which one is the most appropriate for my case between the three below?
-MPI
-TBB
-TOP-C
Is there a simple way to use 48 threads in MT with my application or because I have 2 processors should I use parallelization?
Thank you for your help
Do you have code which writes to a (shared) output file for each event? Geant4 events are typically very fast to generate (tens of milliseconds), so you could be getting hit with mutexing slowdowns.
Geant4 doesn’t do any parallelization within the simulation code. The Run Manager creates worker threads, each of those threads then runs as a simple sequential process, generating events. Events get merged into the run output along the way, or (using G4Analysis stuff) at the end of the run.
Thank you for your answer. In my own code I have a shared output file which is filled at the end of each event in EventAction.cc :
void EventAction::EndOfEventAction(const G4Event* event)
{
.
.
.
G4AnalysisManager* analysisManager = G4AnalysisManager::Instance();
analysisManager->FillH1(0, deposit_energy);
#ifdef G4MULTITHREADED
    static G4Mutex stuffMutex = G4MUTEX_INITIALIZER;
    G4AutoLock al(&stuffMutex);
#endif

static std::ofstream stuff("stuff.csv");
stuff << deposit_energy  << std::endl;
.
.
.
}
Is the above code an unsafe way to fill an output file in MT?
But what about the Example B1 I would like to run in MT without changing anything in the code. Why I don’t get the fastest simulation time with 48 threads.
Thank you for your help
It’s definitely not unsafe, but it’s inefficient (and inescapable in this model. The mutex lock can dominate your job time when you have a lot of threads, and the event processing time is very short. You end up with the threads spending most of their time waiting for each other, and the effective throughput starts to look like sequential running 
Thank you very much. I understand mutex block the simulation waiting end of events.
For now I am calling at each step in SteppingAction two inline functions written in EventAction.hh to :
- fill an Ntuple with x,y,z position and saved it in a csv file in EventAction.cc.
- sum total energy deposit of each step in a run and fill an histogram in Event Action.cc.
What is the best way to sum the total energy deposit of each event in a run and also save x,y,z positions of each event, should I use G4Analysis.cc? Build as much csv output file as threads?
My understanding is that if you use G4Analysis, it can take care of the merging across threads in an automatic way for you. I don’t know enough about it to give you code guidance, but it seems like many of the advanced and extended examples make use of it, both for histograms and for proper N-tuples.
Thank you for your help, I will try to use G4Analysis for saving particles interactions positions.