Hi,
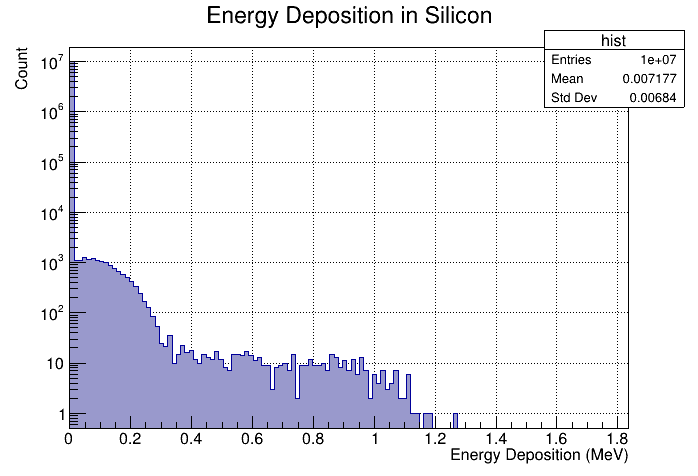
I was doing a GEANT4 simulation of a silicon detector with the cobalt 60 source in front of it. I have used the G4Radioactive decay module and used the default Co60 source using GPS. The Co 60 has two beta decay channels yielding 317 keV and 1.48 MeV beta endpoint energies. Also, there are two gamma channels of energies 1.3325 MeV and 1.1732 MeV. The silicon detectors won’t be able to provide the gamma peaks, but during the experiment, I could see there are two escape electron peaks by these gammas around 1.16 and 1.3 MeV. But my simulation is giving the endpoint energy deposition up to 1.2 MeV, whatever the thickness of the detectors I used. I have used 1mm, 2 mm and 4 mm detectors in the simulation, but the endpoint energy is still at 1.2 MeV. I am attaching my spectrum of 60Co obtained using the 2mm thick silicon detector and my source macro along with this post. I am not sure if I made a mistake in my modelling. Counting on your help and thanks a lot for the interest.
Your spectrum looks kind of like what I would expect. The low energy bump is the 0.31 MeV beta and its end point energy is roughly correct. The electron range in silicon is ~4.5mm, so for 2 mm detector almost all of the energy will be absorbed. The 1.48 MeV beta has a 0.12% branching ratio so I wouldn’t expect too many to appear even if the full energy were absorbed. However, the stopping power of that energy electron in silicon is ~0.356 MeV/mm. In a 2mm detector, it would not deposit more than ~0.7 MeV. The 1.173 and 1.332 MeV gammas will have no full energy peaks in such a small low Z detector. You might be able to see the Compton edges at 0.962 MeV and 1.113 MeV with good enough statistics. However, the stopping power is similar to that of the 1.48 MeV (beta) electron, so again only about 0.7MeV will be absorbed. I know that’s a very crude analysis, but I do not see an obvious problem.
Hello,
Thanks a lot for your valuable response and time. It is very evident from the simulation result you shared that the end point energy is approximately 1400 keV. I used the default cobalt 60 present in GPS in my simulation. I thought it would be the reason for the difference in the end point energies in my simulation and the one you shared. But now I have changed the particle source in my simulation also, as partilce gun and repeated the simulation using your macro. Still I am getting the same result as I previously got. I have then tried the simulation using the TestEM1 simulation and I got the spectrum very much similar to the one you got. I was trying to figure out where the problem could be. I am not sure what could be the reason for it…As both the GPS and particle gun give the same results, I guess it is not the primary generator. I am suspecting if it is my physics list or anything giving this difference. I couldn’t find any reason for such a discrepancy. I am sharing my physics list, run action and other relevant files here.
Thanks a lot for your valuable suggestions and interest. PhysListEmStandard.cc (6.8 KB) PhysicsListMessenger.cc (5.6 KB) PhysicsList.cc (12.0 KB) B4RunAction.cc (3.8 KB) B4aSteppingAction.cc (1.5 KB) B4aEventAction.cc (3.2 KB)
In TestEm1, the source is just at the boundary of silicon.
In your setup, I guess that the source is few cm in front of silicon.
What is the World material ? (air ?). What is the energy lost by e- before to enter in silicon ? (few hundred keV ?)
Yes. You are absolutely right. In my setup, I have a thin mylar window in front of my source which attenuates a few keV of energy. Also, the source is at a distance of 5 cm with a vacuum of nitrogen at 0.1 pascal pressure. Also there is a few nanometer thin gold and silicon dioxide dead layer in front of my silicon wafer. As you mentioned I checked the position of source in TestEm. So it is the additional layers which cause the energy deposition cause the change in my case. Thanks a lot for the valuable time and suggestions John and Maire.