Please fill out the following information to help in answering your question, and also see tips for posting code snippets. If you don’t provide this information it will take more time to help with your problem!
Geant4 Version: 11.2.1
Hi all, Happy New Year!
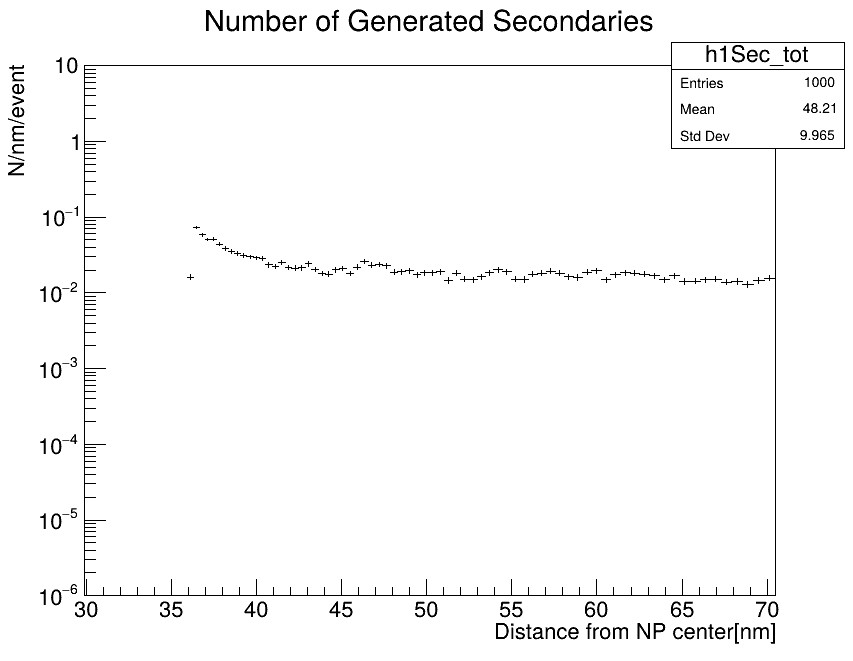
Perhaps a silly question but I was playing around with the extended/medical/dna/AuNP example and was a bit confused by one of the outputs. One of the plots produced is the location of secondary particles created outside of the nanoparticle (r=50nm). However this histogram has bins down to r=36nm, which I don’t believe should be shown.
I believe it’s filled in TrackingAction so I added this print statement:
 if(RNP<R && track->GetTrackID() != 1 ){
  // my check -------------------------------------------
  if ((RNP<50)||(R<50)){
    G4cout<<"Position: "<<R<<'\n'<<"RNP: "<<RNP<<G4endl;
  }
  // ----------------------------------------------------

  if(track->GetDefinition()->GetPDGCharge() != 0){
     analysisManager->FillH1(6,R);  //<-- this line
     analysisManager->FillH2(1,R,trackE);
   }else {
     analysisManager->FillH1(7,R); //<-- and this line
     analysisManager->FillH2(2,R,trackE);
   }

 }
and nothing prints. I’ve checked in the root TBrowser and its the bins <50nm are filled before running the plot.C macro so I assume that means it’s being filled during the simulation, but a debug print statement shows it shouldn’t be. From my understanding, these bins shouldn’t be filled, I’m curious if I’m misinterpreting something.
My question is a bit broad, but what is causing this to be filled? If anyone has any input it would be appreciated, thank you in advance!