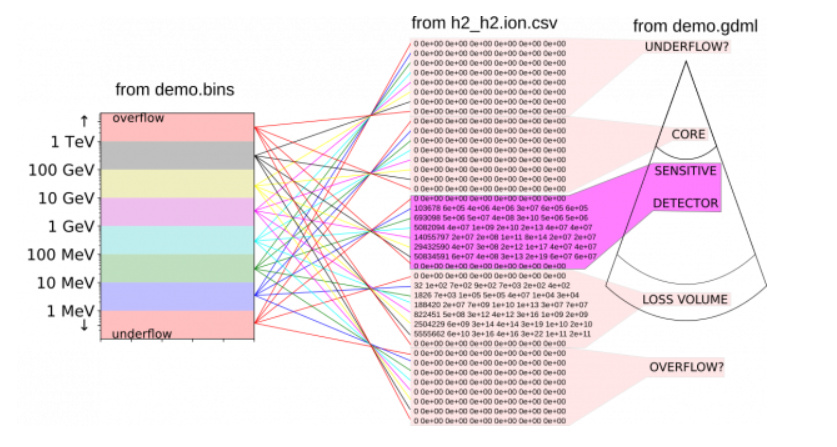
I am very new to geant4 and I am attempting to score the energy depos due to the radioactive decay of Tb160 in a lead box. I have used extended/radioactive decay as a template and also B4 for scoring purposes.
I plotted a 1D histogram and the results are below. I understand that each line represents a bin and the entry is the number of entries (i.e. number of energy deposits in that bin, im assuming but not sure), sw and sw2 are the sum of the weights and sum of weights squared. However, I dont know what the last 2 columns represent.
#class tools::histo::h1d
#title energy spectrum (%): gamma
#dimension 1
#axis fixed 100 0 4
#annotation axis_x.title [MeV]
#bin_number 102
entries,Sw,Sw2,Sxw0,Sx2w0
0,0,0,0,0
6480,64.8,0.648,0.613917,0.00671822
5865,58.65,0.5865,3.78063,0.254054
2490,24.9,0.249,2.17144,0.189932
144,1.44,0.0144,0.197894,0.0273862
575,5.75,0.0575,1.11851,0.217887
485,4.85,0.0485,1.04961,0.22727
31,0.31,0.0031,0.0800041,0.0206774
2699,26.99,0.2699,8.06821,2.41199
44,0.44,0.0044,0.148602,0.0502019
125,1.25,0.0125,0.489444,0.191662
9,0.09,0.0009,0.0385254,0.0164977
8,0.08,0.0008,0.0367079,0.0168588
24,0.24,0.0024,0.120672,0.0607047
5,0.05,0.0005,0.0267369,0.014303
3,0.03,0.0003,0.0177131,0.010459
2,0.02,0.0002,0.0121819,0.00742009
2,0.02,0.0002,0.0133872,0.00896179
67,0.67,0.0067,0.457901,0.312962
2,0.02,0.0002,0.0145896,0.0106437
192,1.92,0.0192,1.46933,1.12445
0,0,0,0,0
2921,29.21,0.2921,25.6847,22.5849
0,0,0,0,0
0,0,0,0,0
3572,35.72,0.3572,34.4715,33.2668
112,1.12,0.0112,1.12331,1.12663
8,0.08,0.0008,0.0855239,0.0914293
195,1.95,0.0195,2.16864,2.41185
0,0,0,0,0
1753,17.53,0.1753,20.7097,24.4672
0,0,0,0,0
731,7.31,0.0731,9.29577,11.821
323,3.23,0.0323,4.23461,5.55176
0,0,0,0,0
0,0,0,0,0
0,0,0,0,0
0,0,0,0,0
0,0,0,0,0
0,0,0,0,0
0,0,0,0,0
0,0,0,0,0
0,0,0,0,0
0,0,0,0,0
0,0,0,0,0
0,0,0,0,0
0,0,0,0,0
0,0,0,0,0
0,0,0,0,0
0,0,0,0,0
0,0,0,0,0
0,0,0,0,0
0,0,0,0,0
0,0,0,0,0
0,0,0,0,0
0,0,0,0,0
0,0,0,0,0
0,0,0,0,0
0,0,0,0,0
0,0,0,0,0
0,0,0,0,0
0,0,0,0,0
0,0,0,0,0
0,0,0,0,0
0,0,0,0,0
0,0,0,0,0
0,0,0,0,0
0,0,0,0,0
0,0,0,0,0
0,0,0,0,0
0,0,0,0,0
0,0,0,0,0
0,0,0,0,0
0,0,0,0,0
0,0,0,0,0
0,0,0,0,0
0,0,0,0,0
0,0,0,0,0
0,0,0,0,0
0,0,0,0,0
0,0,0,0,0
0,0,0,0,0
0,0,0,0,0
0,0,0,0,0
0,0,0,0,0
0,0,0,0,0
0,0,0,0,0
0,0,0,0,0
0,0,0,0,0
0,0,0,0,0
0,0,0,0,0
0,0,0,0,0
0,0,0,0,0
0,0,0,0,0
0,0,0,0,0
0,0,0,0,0
0,0,0,0,0
0,0,0,0,0
0,0,0,0,0
0,0,0,0,0
0,0,0,0,0
0,0,0,0,0
In the end I am trying to produce a histogram of the counts vs energy deposited in the lead medium in order to produce an energy spectrum.
Is there a way to convert the histogram the above to get this or would I have to make changes in the code?
Any help would be very appreciated.
 )
)