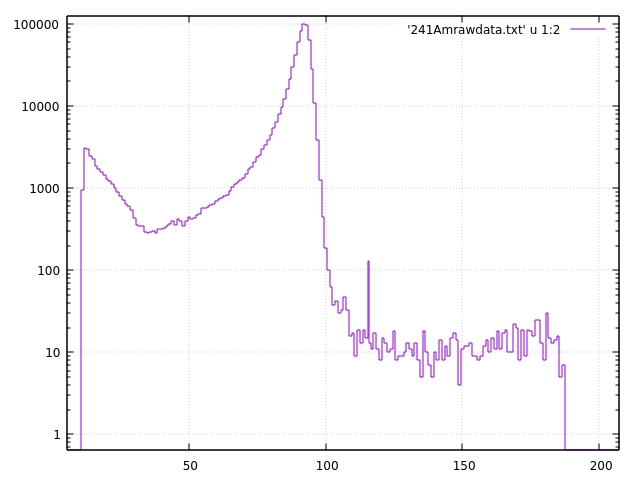
Hi, I was simulating the alpha spectrum given by a silicon (PIPS) detector in Geant4. In the experiment the alpha source was placed about 4 cm distance and the spectrum was obtained. Its an ORTEC made TB-20-100-2000 detector which means the manufacturer given thickness is 2000 micrometer = 2mm and active area =100 mm^2. I have simulated the same detector in GEANT4 with the source detector distance as used in the experiment. But the obtained spectrum alpha peak has FWHM far lower than the one obtained experimentally. I have varied various geometrical parameters like the source distance separation, effective area of the detector as the bias voltage may affect it and the Boron dead layer thickness. But these variations also cannot account the large difference between theory and simulation. I am attaching the experimental spectrum along with the one that I simulated using GEANT4.
241Amrawdata.txt (7.6 KB)
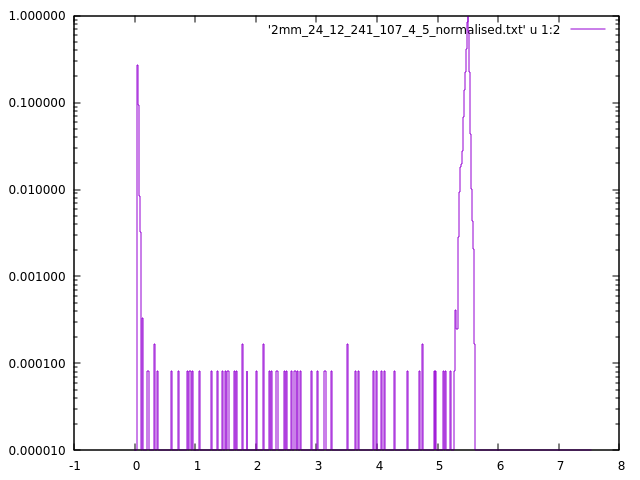
2mm_24_12_241_107_4_5_normalised.txt (5.7 KB)
The file ‘241Amrawdata.txt’ contains the raw experimental data which is not normalised and the second file ‘2mm_24_12_241_107_4_5_normalised.txt’ contains the simulated data with the data normalised on the maximum height. The difference in the FWHM of the peak is evident. I am attaching the source macro and detector construction.cc files here for the reference.
Also the experimental and theoretical spectra are like this
B4DetectorConstruction.cc (9.1 KB)
run1.txt (502 Bytes)
I have used the /grdm/nucleusLimits 240 250 94 96 command in run macro to take out the spontaneous fission events from the spectrum.
What is your initial alpha spectrum? Did you include all layers of the source?
My guess is that you do not collimate alphas, so energy loss is relatively arbitrary in the passive layers. Thus, the losses are the culprit making the spread in the spectrum. The thickness of the silicon should not matter as alphas are absorbed in the first tens of microns, unlike the dead layer thickness, which also may be somewhat uneven for a 2000 um detector taking away some unknown energy.
which version of Geant4 did you use? I suggest to use Geant4 11.01.
cheers
Susanna
Hi, thanks a lot for the response and your valuable time. I was digging on the problem and finally found few facts. As you mentioned there are layers in source and I had included that in my simulation. There was a thin layer of mylar in the source geometry and that is accounted in the simulation. Also about the detector geometry, I have simulated SSB detector which has a very thin layer of gold evaporated in the entrance window (few nanometers of thickness). To account that I have included a very thin layer of gold with the corresponding thickness in my simulation. Even after all these efforts, the Geant4 simulated spectrum has way lower spread when compared to the experimental spectrum. I tried to simulate my own Am 241 instead of the one from the GPS. Then the absorption peak at 5.486 MeV was becoming something like a delta function.
I am not sure why I cannot get the expected spread in the simulation even after I tried to mimic everything from the experiment as realistic as in the simulation. Then I found out this paper
and this explains about the method of gaussian smearing the theoretically obtained peaks using different resolution functions such as crystal ball function and all. So I have decided to do the same with my simulation also. I guess that the resolution of the detector response function is a complicated mix of many parameters such as electron hole pair statistics, straggling losses in dead layers and more importantly the electronic noises implemented etc. Considering these as statistically independent processes, we need to take the convolution of these functions as the resolution of the detector response function. There are different functions already in use I guess like the gaussian with the exponential and lorentzian tails, crystal ball function etc. In my case I could get a best fit with my detector response as the convolution of Gaussian with a lorentzian tail. I just explained this as it can be helpful for someone who is trying the same.
Yes. Thanks a lot for the response. I have tried with the different version of G4 and the result is the same.