Differences with physics list choice in Hadr03 example

Dear all,

Since I’m a beginner in hadron simulation I have tried to do some tests with the Hadr03 example.

The problem I would like to study is quite simple: determine the isotope production rates when a monochromatic proton beam of 20 MeV interacts with pure 18O, but the problem is not really relevant to my question.

I modified only the following lines of mac file of the example to set the target composition and primary particle properties with the hadElastic process active.

/testhadr/det/setIsotopeMat O 8 18 1 g/cm3
/gun/particle proton
/gun/energy 20 MeV
/process/activate hadElastic

I run the example with 1 M primary particle switching to different hadronic physics lists in the PhysicsList class: FTFP_BERT_HP, QGSP_BERT, QGSP_BIC, FTF_BIC.

Here is my question:
I have observed that the yield of particles produced (and also the energy) is very different when the “BERT” or the “BIC” model is used:

BERT output:

List of generated particles:
B11: 22 Emean = 2.749 MeV ( 571.54 keV → 6.3567 MeV)
C12: 218 Emean = 2.3697 MeV ( 72.483 keV → 5.9657 MeV)
C13: 2 Emean = 2.1422 MeV ( 1.7018 MeV → 2.5825 MeV)
C14: 1362 Emean = 2.3995 MeV ( 5.8483 keV → 6.8302 MeV)
F17: 184 Emean = 1.2408 MeV ( 84.233 keV → 2.9278 MeV)
F18: 1145 Emean = 1.3029 MeV ( 38.533 keV → 3.5653 MeV)
N14: 1341 Emean = 2.5116 MeV ( 48.403 keV → 6.5196 MeV)
N15: 664 Emean = 4.1032 MeV ( 453.49 keV → 9.0303 MeV)
N17: 1 Emean = 281.42 keV ( 281.42 keV → 281.42 keV)
O16: 4535 Emean = 1.3871 MeV ( 14.094 keV → 5.875 MeV)
O17: 5860 Emean = 1.276 MeV ( 7.7884 keV → 4.0886 MeV)
O18: 38722 Emean = 636.57 keV ( 8.3534 eV → 4.0469 MeV)
alpha: 3631 Emean = 7.0502 MeV ( 1.1076 MeV → 21.77 MeV)
deuteron: 1516 Emean = 3.8599 MeV ( 773.93 keV → 12.512 MeV)
gamma: 33426 Emean = 1.4499 MeV ( 19.224 keV → 11.335 MeV)
neutron: 14798 Emean = 3.1475 MeV ( 3.4228 keV → 16.305 MeV)
proton: 11633 Emean = 6.3368 MeV ( 253.92 keV → 18.755 MeV)
triton: 954 Emean = 5.2002 MeV ( 648.68 keV → 14.549 MeV)

BIC output:

List of generated particles:
B11: 1007 Emean = 3.0776 MeV ( 43.09 keV → 8.8192 MeV)
C12: 1020 Emean = 2.4898 MeV ( 943.9 eV → 6.2406 MeV)
C13: 297 Emean = 2.0035 MeV ( 112.68 keV → 4.5805 MeV)
C14: 446 Emean = 2.6509 MeV ( 13.864 keV → 7.1889 MeV)
F17: 30 Emean = 1.0983 MeV ( 230.15 keV → 1.9956 MeV)
F18: 715 Emean = 1.6782 MeV ( 36.196 keV → 3.7512 MeV)
He3: 5 Emean = 2.7647 MeV ( 1.5147 MeV → 4.2225 MeV)
Li6: 254 Emean = 3.0887 MeV ( 673.9 keV → 6.2305 MeV)
N14: 6233 Emean = 2.2145 MeV ( 10.274 keV → 6.925 MeV)
N15: 646 Emean = 3.9146 MeV ( 418.15 keV → 8.3915 MeV)
N16[120.420]: 5 Emean = 1.6021 MeV ( 235.23 keV → 2.105 MeV)
O16: 362 Emean = 1.4339 MeV ( 39.167 keV → 4.4528 MeV)
O17: 5309 Emean = 1.6906 MeV ( 7.0063 keV → 4.6191 MeV)
O18: 37986 Emean = 640.44 keV ( 8.3534 eV → 4.0469 MeV)
alpha: 9570 Emean = 5.4259 MeV ( 331.55 keV → 18.779 MeV)
deuteron: 3870 Emean = 7.6367 MeV ( 581.95 keV → 13.954 MeV)
gamma: 22952 Emean = 2.799 MeV ( 52.511 eV → 11.656 MeV)
neutron: 8906 Emean = 3.9191 MeV ( 9.1201 keV → 16.704 MeV)
proton: 3524 Emean = 7.003 MeV ( 840.76 keV → 19.378 MeV)
triton: 342 Emean = 3.6162 MeV ( 493.93 keV → 8.4504 MeV)

Is that right or am I doing something wrong?
In this energy range shouldn’t the two models provide similar cross-sections?

Additionally, if I turn the EM process ON, the number of particles produced changes a lot with high dependence on the particular EM physics list (I have tried the standard and option4, with a factor of 2 in the production yield).

I have attached a txt file with the output of the all tests.

Since in EM simulations I have never observed such pronounced differences, I’m wondering:

How to choose the physics list if the differences are so pronounced?

Thank you for your help

_Geant4 Version:_11.0.3
_Operating System:_Windows 11
_Compiler/Version:_Visual studio 2022
_CMake Version:_3.22.2

Hadr03.txt (11.8 KB)
Hi Andrea

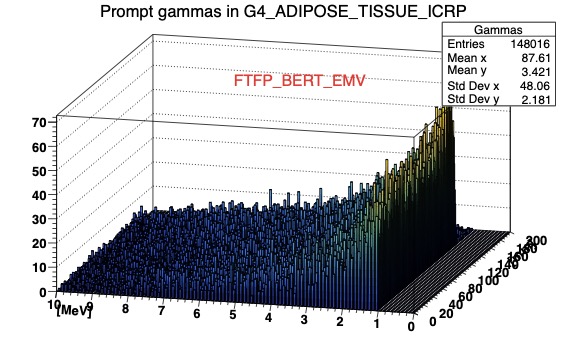
I too have recently found that FTFP_BERT and QGSP_BIC_HP are profoundly different for low energy (10-200 MeV) protons. It is the latter physics list that is used by TOPAS, the app that wraps Geant4 for (primarily) proton therapy (https://www.topasmc.org), so that is the one I am going to use.

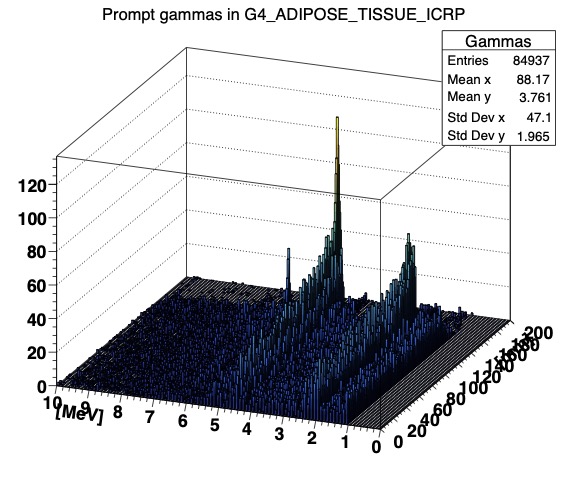
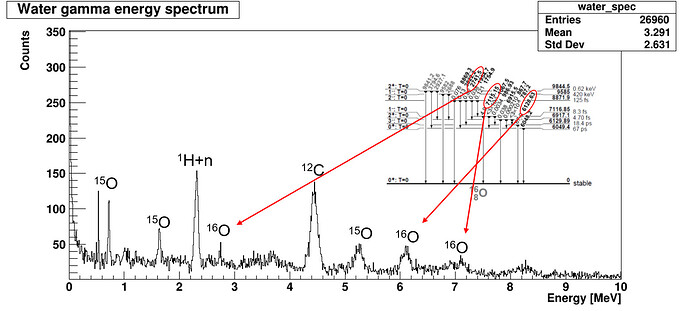
I attach some lego plots of gamma spectrum along the proton beam for 150 MeV protons that show this difference. I am currently trying to validate the gamma spectrum against some data - also attached.

So my recommendation is: use QGSP_BIC_HP.

John

FTFP_BERT_EMV_G4_ADIPOSE_TISSUE_ICRP_lego2

QGSP_BIC_HP_G4_ADIPOSE_TISSUE_ICRP_lego2

The 2nd image was QGSP_BIC_HP_EMZ. Sorry, forgot to annotate.

Hi John ,

I totally agree with you. Maybe I would try to use also QGSP_BIC_AllHP and compare the results to QGSP_BIC_HP

cheers
Susanna

PS. Happy New Year!

Hi John,

Thank you for your feedback and suggestions.

The two plots you showed are obtained with two different EM physics lists (option1 and option4), right?
I tried to run the example with the standard (and option1 with the same results) and the option4 and I saw that there is about a factor 2 in the number of particles produced.

In “EM-only” simulations I expect that the results obtained with the option4 should be more accurate than those obtained with the standard. Is this right also in this case?
If not, what EM physics list do you suggest?

Thanks
Andrea

Hi Andrea

Yes. That was not intentional, but the first was with em option1, the second with option4. I don’t think that will influence the nuclear interactions. The difference in particle numbers that you find might be the different numbers of delta rays or bremsstrahlung from the ionisation processes. Of course, I would go with option4 (_EMZ) unless it becomes a CPU limitation.

I’m still looking into this. I too am new to these hadronic processes (I’m looking at prompt gamma production from the proton beam). I will also try Susanna’s suggestion. If I find anything I’ll report back.

John

Hi John,

The choice of the EM physics list has a deep impact not only on the production of the gammas, but on all particles, in particular in all nuclides produced in hadronic reactions, as you can see from the tables in the file I attached (last four tables).

Since the hadronic cross sections depend on the proton energy, the way in which the EM processes modify the energy of the primary particle has a non-negligible effect on the resulting reaction probability.

To test this hypothesis I tried to change the StepFunctionMuHad without changing any other parameter of the EM physics list.
The result is that there is a strong correlation between the StepFunction parameters, the first one in particular because it limits the step length at high energy, and the resulting secondary particle produced. The longer the proposed EM steps, the more chance there is for the hadronic processes to win and occur.

For example here is the number of 18O produced with different StepFunction parameters:
SF: 0.2 0.1 mm → 18O: 5094 (default of the option1 )
SF: 0.1 0.1 mm → 18O: 2920 (this is similar to the option4 SF: 0.1 0.05 mm)
SF: 0.05 0.1 mm → 18O: 1951
SF: 0.01 0.1 mm → 18O: 1031
SF: 0.01 0.01 mm → 18O: 312

Now, I’m wondering how can the simulation be used to predict the experimental results if there is such a correlation between the SF parameters and the resulting reaction probability, without any sort of “asymptotic” value.

Andrea

Hi Andrea

I am struggling to understand your results. The number if particles produced in a given length of track should not depend on step length, within statistical variations. Are your figures for the same length of track - the 20 MeV proton in 16O - or per step. Of course they will change per step, in proportion to the step length. Geant4 assigns an interaction length to each process and each one gets its turn, so to speak. (I could say more on that, but it’s described in Geant4 - A Simulation Toolkit, S. Agostinelli et al., Nucl. Instrum. Meth. A 506 (2003) 250-303).

So I can understand your results: the ratio n/SF should be constant, within statistics. (Not sure I understand the SF range - I take the first - mmm?).
5094/0.2
2920/0.1
1951/0.05
1031/0.01
312/0.01
No, sorry, don’t understand the two SF numbers. But you see what I mean?

I attach two plots - the gamma spectrum from a proton beam in water with em option1 (EMV) and with em option4 (EMZ). There is little difference. It should compare with the experimental data above. I should say that this is with 150 MeV protons in water and I think I have captured every gamma above 1 MeV.

[QGSP_BIC_HP_EMV_G4_WATER_1e7.pdf|attachment]
(upload://9zZE8MsyRk6KUwV2dOVroZJycyb.pdf) (21.4 KB)

QGSP_BIC_HP_EMZ_G4_WATER_1e7.pdf (21.4 KB)

The pdfs don’t seem to have uploaded correctly - I try again.

QGSP_BIC_HP_EMV_G4_WATER_1e7.pdf (21.4 KB)
QGSP_BIC_HP_EMZ_G4_WATER_1e7.pdf (21.4 KB)

P.S. The CPU times for 1e7 events were:
option1: 429 s
option4: 733 s

Hi John,

The ScalingFunction is a function that controls the energy loss process. The first parameter represents the maximum fraction of the track energy that can be lost in the step and the second is the minimum step length. Generally, the first parameter controls the step length when the energy of the particle is “high” (at the beginning of the propagation) and the second when the energy is “low” (at the end of the propagation). In the middle it is a smooth function between the two extremes.
https://geant4-userdoc.web.cern.ch/UsersGuides/PhysicsReferenceManual/html/electromagnetic/energy_loss/enloss.html

In my understanding, when the energy loss process proposes a step length, the length depends on the parameters of the StepFunction and for this reason it could be higher or lower.
Statistically, if the eLoss proposes steps that are smaller on average, there is higher probability that they are chosen, and so fewer “other processes” are chosen (among which hadron inelastic that produces the nuclides).
On the other side, the particle requires more steps to stop and so there are more “chances” (steps) for the other processes to be chosen.
I hope that these two effects compensate each other in order to provide a coherent propagation of the tracks with different SF parameters and, as you said, make the number of particles produced independent of individual steps but only of the total length of the track.

Returning to my results, I found that the example Hadr03 aborts the events after the first step and I suspect that for this reason the “compensation effect” of having more steps is not present and so only the first effect is observed.
By looking at your plots, I see that the number of gammas are consistent within the statistical fluctuation and this is encouraging.

I would like to do some tests about this using my application but that requires me to add some features and I’ll do that as soon as I have time to implement them.

If it is easy for you, you could check not only the gammas but also the number of nuclides (and other secondaries) produced during the proton propagation to verify that the production yield does not depend on the StepFunction parameters (EM physics list).

Andrea

Hello,

The current recommendation for low-energy physics as Susanna explained:

QGSP_BIC_HP_EMZ

We recommend to compare results with more fast but less accurate in some aspects

QGSP_BIC_HP and QBBC

EM Option1 (EMV) is a special variant of of EM physics, which is fast but can provide reasonable results only in specific cases (if there are no thin layers of different materials, if e- back-scattering is not important). Such cases are known for high energy HEP experiments.

VI