I have been trying to replicate some neutron spectra using /gps/hist
I have the data as a flux with an associated maximum energy, logarithmically binned into 640 groups between 1E-10 and 20MeV:

I calculated a integral spectrum from these and put these values into a file EnergySpectrum.mac in the format:
/gps/hist/point
and use:
/gps/ene/type Arb
/gps/ene/diffspec 0
/gps/hist/type arb
/control/execute share/EnergySpectrum.mac
/gps/hist/point 20.1 0
/gps/hist/inter Lin
as demonstrated in test24.mac of examples/extended/eventgenerator/exgps/macros
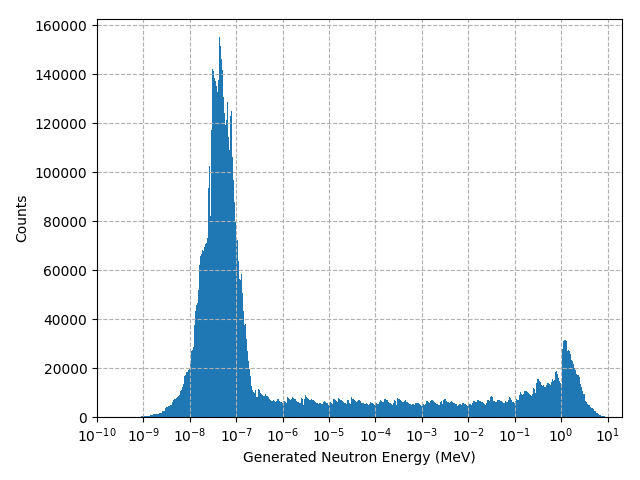
The resulting energy distribution has both the fast and thermal peaks that were there originally. However, the ratio between the two peaks is off. Instead of a 5:1 Thermal:Fast, I have something closer to a 7:1 ratio. The jump in flux just above 1MeV seems to have been cut off. In fact, it looks pretty similar to what happens if I make a lethargy spectrum of the original data.
Any help or insight into how the /gps/hist functions or how to get the correct peak ratio out would be greatly appreciated.