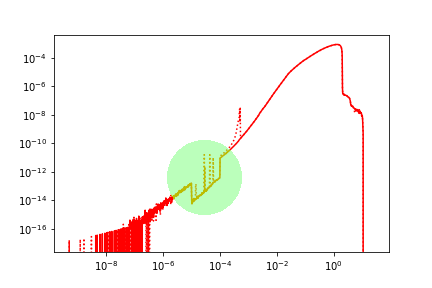
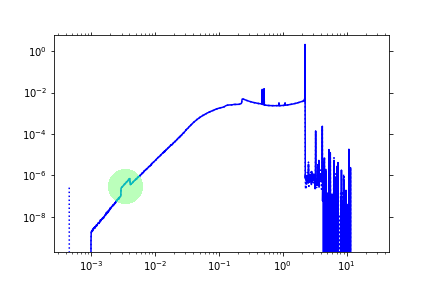
I calculated the total particle flux inside a cylindrical water phantom, and for photons and electrons I am observing some discontinuities: there is a sudden increase for 2-4 keV photons and a drop for 10-100 eV electrons.
I tried different electromagnetic models (Penelope, Livermore, Standard option 4), and I tried switching on Auger and fluorescence, but the gaps are still there. These should not have an important effect in our results, but I am curious. Instead of blinding guessing what’s its cause, I thought I’d better ask here
Below are some plots showing the features I am describing, using the Livermore EM model (with Auger etc on in dotted lines for comparison).
what is represented on the x axis? what is on the why axis?
Which is the cut you are applying? are you also fixing the energy threshold limit, e.g. by means of
/cuts/setLowEdge. How do you record the results? do you use any kind of voxelisation? Did you use a Geant4 example as a starting point to calculate the physical quantities represented in the plots?
Thanks a lot for your reply! Sorry about the late reply, I was on vacation last week…
Let me elaborate:
The physical world consists simply of a 24 cm long by 20 cm diameter water (with 1ppm ¹⁰B) cylinder inside an air cube. (Note: There is a voxelized grid in a parallel world, but this should not play a role in the results shown here). The results are recorded using a custom detector derived from G4SensitiveDetector; in summary I collect the length of every simulation step, and classify according to particle type and kinetic energy. The source is a point source shooting 10 keV neutrons into one of the faces of the cylinder.
Cuts and energy were the default ones. The physics processes are all used with the default configuration; the only bits I’ve fiddled with is setting up the low energy neutron physics, following the manual.
The graphs show the total track length for secondary electrons and photons in cm, with respect to kinetic energy in MeV.
Dear Sergio, so if I understand correctly you are plotting the particle track of photons and electrons generated in the detector by neutrons? I suppose the electrons are generated as secondaries from the tracks of the nuclei that emerge from nuclear interactions of the neutrons.
I do not understand the results. The track length depends on the physics processes that are happening and also on the physical sizes of the sensitive volume geometry. Are the particles absorbed in the water phantom or exit from it?
What I suggest to do is to take a step back and investigate more in depth what is happening. For example,
plot the edep due to the neutron field in the water cylinder with respect to depth. You can distinguish secondary particle types and their contribution to edep. Check if the results are what you expect.
Plot the energy spectra of the secondary particles of interest at different depths in the water phantom. Again, are the results expected?
Then, I think it is important you investigate which particles are absorbed and which particles exit the phantom, because that will influence your track length vs energy plot.
Thank you very much for your kind help and patience! Disclaimer: I come from a different field of computational physics, so my apologies for the confusing explanations…
I do not understand the results. The track length depends on the physics processes that are happening and also on the physical sizes of the sensitive volume geometry.
I did not explain myself clearly: What I plotted was actually the spectra, ie particle flux vs energy. The particle flux was calculated by accumulating the track lengths of all secondaries inside the phantom. I calculated the spectrum for the whole phantom, instead of at some small volume at a given depth.
plot the edep due to the neutron field in the water cylinder with respect to depth. You can distinguish secondary particle types and their contribution to edep. Check if the results are what you expect.
I actually had already verified that depth curves (edep, kerma and particle fluence) match the results obtained with MCNP. So in principle I am confident that the simulation “works”.
Plot the energy spectra of the secondary particles of interest at different depths in the water phantom. Again, are the results expected?
Ah, I actually found a reference for the photon spectrum at 2.5 cm depth, and it has similar features to my “total” spectrum. The spectrum is in linear coordinates though, so the discontinuities I am talking about would be impossible to observe.
I hope this clarified a bit what I am doing? I’ll try to rephrase: I am observing some discontinuities in the photon and electron spectra at low energies, and I don’t know if it’s a mistake I made or a feature
no worries. The flux is calculated considering a surface, not a volume. Why do you do it in a volume? If you want to determine the flux, you should record the energy of the secondary radiation when traversing a specific surface. For example traversing sections of the water cylinder at different depths. You can use the scoring mesh to record the flux.
It is good the sim works.
Hi again,
Hm, calculating fluences by adding the step lengths inside the voxel was the method that was explained to me. In any case, I think both approaches should be practically equivalent? I mean, calculating the fluence in a cubic volume is the same as calculating the average of the fluences of the infinite set of stacked square surfaces that make up the cubic volume. Instead of counting particles passing a surface, adding the step length tells how many surfaces would be crossed.
One thing I like about calculating fluences like this is that it makes it more straightforward to compare edep doses to kerma (ie, fluence*kerma factor) doses, since they account for what is happening inside the same voxel.
I wonder where I could find some discussions comparing both approaches…