Dear expert,
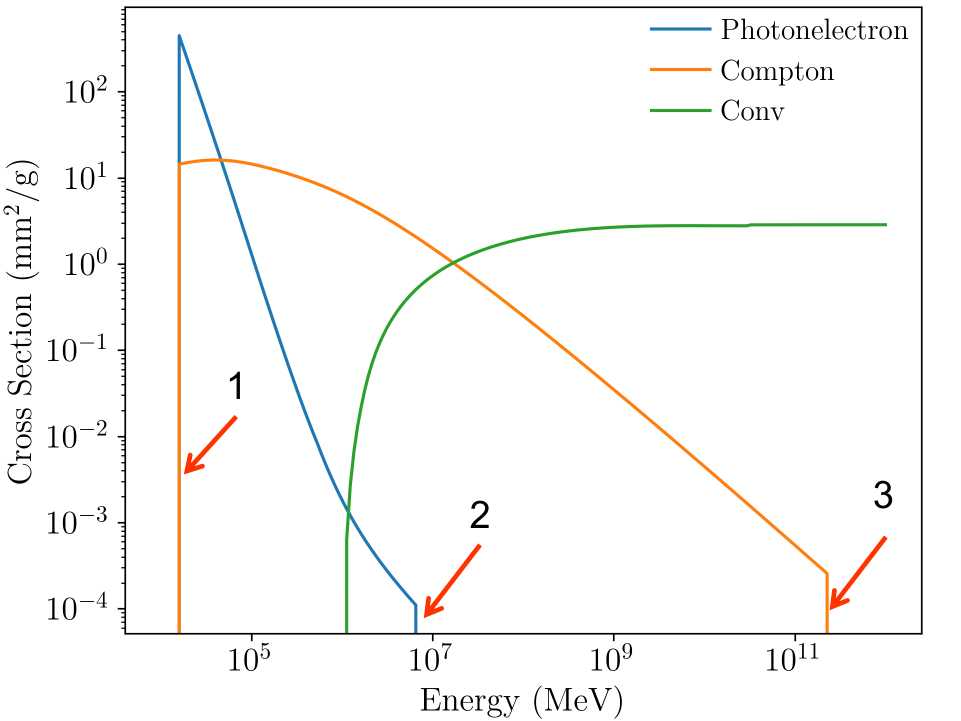
I plotted TestEm13 the cross sections of SiO2 using the example TestEm13. And there are discontinuous points (1,2,3) shown in the figure below, can any one can tell me how to get a continuous curve in the case? Thank you !
_Geant4 Version: geant4-11-00-patch-04 [MT] (3-March-2023)
_Operating System: Rocky Linux 8.6
_Compiler/Version: GCC version 8.5.0
_CMake Version: 3.20.2