Title: Discrepancies between my Geant4 neutron-monitor simulation and published results
I am trying to reproduce the neutron-monitor simulation described in the following paper:
https://www.sciencedirect.com/science/article/abs/pii/S0168900213011893
For each run, my Geant4 simulation generates a fixed number of primary particles with a fixed energy and normal incidence on the detector surface. The incident particles can produce secondary neutrons, which are moderated and eventually captured in the BF₃ gas through the reaction
¹⁰B(n, α)⁷Li.
I count only alpha particles that satisfy my detection criterion and therefore produce a measurable signal. I do not count every alpha particle generated in the simulation.
For each primary-particle energy, I calculate the following
illuminated area × number of detected alphas / number of incident particles
I then plot it as a function of the primary-particle energy and compare it with the results reported in the reference.
For muons and antimuons, I simulate at least 100,000 primary particles per energy because the detection probability is low and the results exhibit large statistical fluctuations. For the other particle types, I simulate 1,000 primary particles per energy.
The results do not agree with the reference, although the level of disagreement depends on the type of primary particle.
The source code is available in the following GitHub repositories:
Simulation workflow
The for-loop.sh script runs the simulation for several energies while keeping the particle type and incidence angle fixed.
For each energy:
-
for-loop.shrunsmodificar_energia.sh, which changes the primary-particle energy. -
It then runs
eje.sh, which builds and executes the Geant4 simulation. -
The simulation results are stored in a ROOT file.
-
An executable compiled from
leer_root.cppreads:-
the number of incident primary particles;
-
the number of detected alpha particles, rather than the total number of generated alpha particles;
-
the energy of the primary particles.
-
-
These values are stored in a CSV file.
After all energies have been simulated, a Python script reads the CSV file and plots both my results and the reference results.
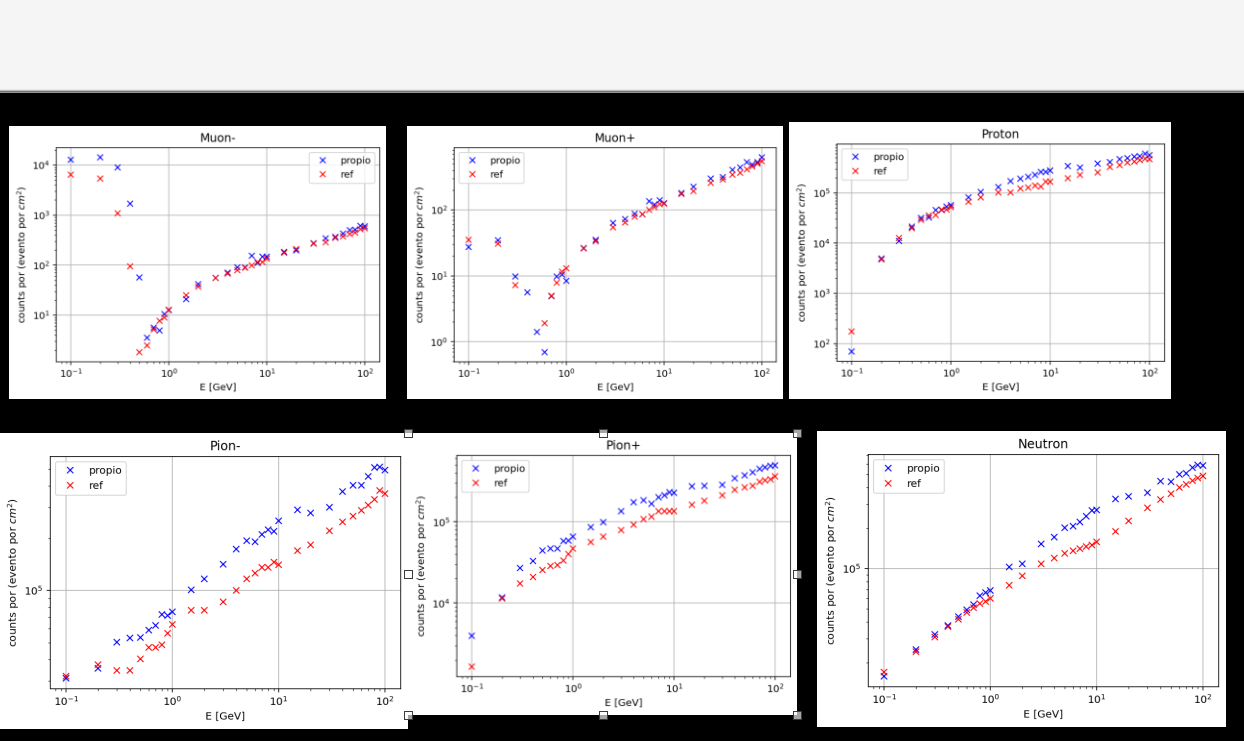
The reference simulation used Geant4 9.6 on Debian Linux.
What could explain the discrepancies between my results and those reported in the paper? In particular:
-
Could changes between Geant4 9.6 and Geant4 11.4.2 significantly affect the production, moderation, or capture of secondary neutrons?
-
Which physics-list settings, production cuts, material definitions, or detection thresholds should I check?
-
Is my calculation of the effective area consistent with the usual definition used for neutron monitors?
Any suggestions about which simulation parameters or parts of the code I should examine would be greatly appreciated.
Geant4 Version: 11.4.2
Operating System: Ubuntu 24.04.4 LTS
Compiler/Version: C++ 11.4.0
CMake Version: 3.16