Dear experts,
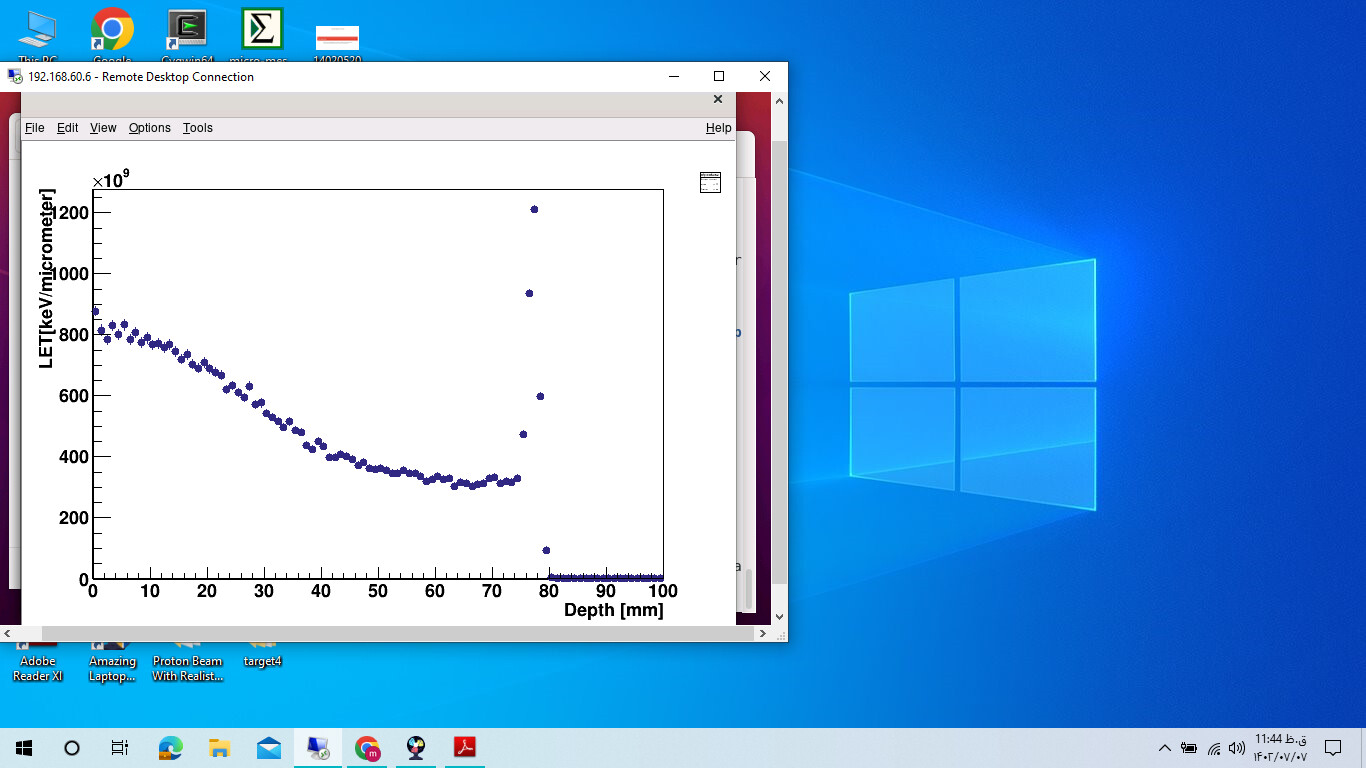
I want to plot dose-averaged LET versus depth. I use these commands in steppingaction but I can’t get the good results.
G4double stepLength = step->GetStepLength();
auto edepStep = step->GetTotalEnergyDeposit();
if (stepLength > 1e-6*mm)
{
G4double LET = edepStep / stepLength;
analysisManager->FillH1(10, zz/mm, LET/keV/um);
}
I attached my graph for a proton beam with 100MeV energy and my reference : the Depth-LET distributions of protons and different ions in a water phantom.
Would you please help me to plot this parameter?
Thank you very much