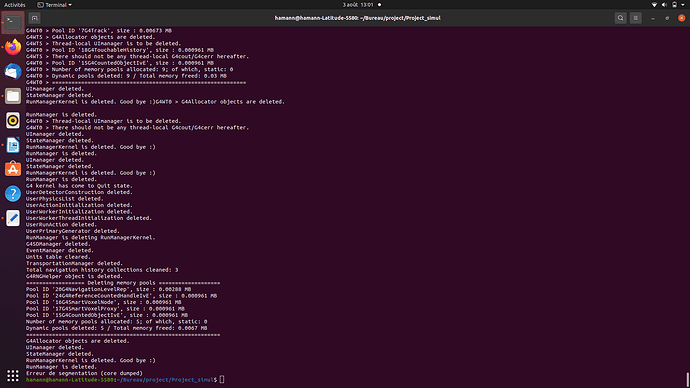
Please guide me on this
‘’’
*** G4Exception : GeomVol1002
issued by : G4PVPlacement::CheckOverlaps()
Overlap with mother volume !
Overlap is detected for volume HollowSphere:0 (G4Orb) with its mother volume Foam (G4Box)
protrusion at mother local point (26.7989,-15.0211,-5.05988) by 298.88 um (max of 65 cases)
NOTE: Reached maximum fixed number -1- of overlaps reports for this volume !
*** This is just a warning message. ***
-------- WWWW -------- G4Exception-END --------- WWWW -------
Checking overlaps for volume HollowSphere:0 (G4Orb) …
-------- WWWW ------- G4Exception-START -------- WWWW -------
*** G4Exception : GeomVol1002
issued by : G4PVPlacement::CheckOverlaps()
Overlap with mother volume !
Overlap is detected for volume HollowSphere:0 (G4Orb) with its mother volume Foam (G4Box)
protrusion at mother local point (26.7995,-14.9566,4.99714) by 299.474 um (max of 96 cases)
NOTE: Reached maximum fixed number -1- of overlaps reports for this volume !
*** This is just a warning message. ***
-------- WWWW -------- G4Exception-END --------- WWWW -------
Checking overlaps for volume HollowSphere:0 (G4Orb) …
-------- WWWW ------- G4Exception-START -------- WWWW -------
*** G4Exception : GeomVol1002
issued by : G4PVPlacement::CheckOverlaps()
Overlap with mother volume !
Overlap is detected for volume HollowSphere:0 (G4Orb) with its mother volume Foam (G4Box)
protrusion at mother local point (26.7953,-4.96803,-4.87375) by 295.283 um (max of 77 cases)
NOTE: Reached maximum fixed number -1- of overlaps reports for this volume !
*** This is just a warning message. ***
-------- WWWW -------- G4Exception-END --------- WWWW -------
Checking overlaps for volume HollowSphere:0 (G4Orb) …
-------- WWWW ------- G4Exception-START -------- WWWW -------
*** G4Exception : GeomVol1002
issued by : G4PVPlacement::CheckOverlaps()
Overlap with mother volume !
Overlap is detected for volume HollowSphere:0 (G4Orb) with its mother volume Foam (G4Box)
protrusion at mother local point (26.7988,-5.05684,4.96933) by 298.841 um (max of 89 cases)
NOTE: Reached maximum fixed number -1- of overlaps reports for this volume !
*** This is just a warning message. ***
-------- WWWW -------- G4Exception-END --------- WWWW -------
Checking overlaps for volume HollowSphere:0 (G4Orb) …
-------- WWWW ------- G4Exception-START -------- WWWW -------
*** G4Exception : GeomVol1002
issued by : G4PVPlacement::CheckOverlaps()
Overlap with mother volume !
Overlap is detected for volume HollowSphere:0 (G4Orb) with its mother volume Foam (G4Box)
protrusion at mother local point (26.7995,4.96503,-5.02143) by 299.533 um (max of 75 cases)
NOTE: Reached maximum fixed number -1- of overlaps reports for this volume !
*** This is just a warning message. ***
-------- WWWW -------- G4Exception-END --------- WWWW -------
Checking overlaps for volume HollowSphere:0 (G4Orb) …
-------- WWWW ------- G4Exception-START -------- WWWW -------
*** G4Exception : GeomVol1002
issued by : G4PVPlacement::CheckOverlaps()
Overlap with mother volume !
Overlap is detected for volume HollowSphere:0 (G4Orb) with its mother volume Foam (G4Box)
protrusion at mother local point (26.7975,5.00175,5.09531) by 297.474 um (max of 79 cases)
NOTE: Reached maximum fixed number -1- of overlaps reports for this volume !
*** This is just a warning message. ***
-------- WWWW -------- G4Exception-END --------- WWWW -------
Checking overlaps for volume HollowSphere:0 (G4Orb) …
-------- WWWW ------- G4Exception-START -------- WWWW -------
*** G4Exception : GeomVol1002
issued by : G4PVPlacement::CheckOverlaps()
Overlap with mother volume !
Overlap is detected for volume HollowSphere:0 (G4Orb) with its mother volume Foam (G4Box)
protrusion at mother local point (26.7996,14.9788,-4.97043) by 299.632 um (max of 82 cases)
NOTE: Reached maximum fixed number -1- of overlaps reports for this volume !
*** This is just a warning message. ***
-------- WWWW -------- G4Exception-END --------- WWWW -------
Checking overlaps for volume HollowSphere:0 (G4Orb) …
-------- WWWW ------- G4Exception-START -------- WWWW -------
*** G4Exception : GeomVol1002
issued by : G4PVPlacement::CheckOverlaps()
Overlap with mother volume !
Overlap is detected for volume HollowSphere:0 (G4Orb) with its mother volume Foam (G4Box)
protrusion at mother local point (26.7972,14.953,5.08808) by 297.231 um (max of 80 cases)
NOTE: Reached maximum fixed number -1- of overlaps reports for this volume !
*** This is just a warning message. ***
-------- WWWW -------- G4Exception-END --------- WWWW -------
Checking overlaps for volume Foam:0 (G4Box) … OK!
World is registered to the default region.
Segmentation fault (core dumped)
‘’’
