Respected experts,
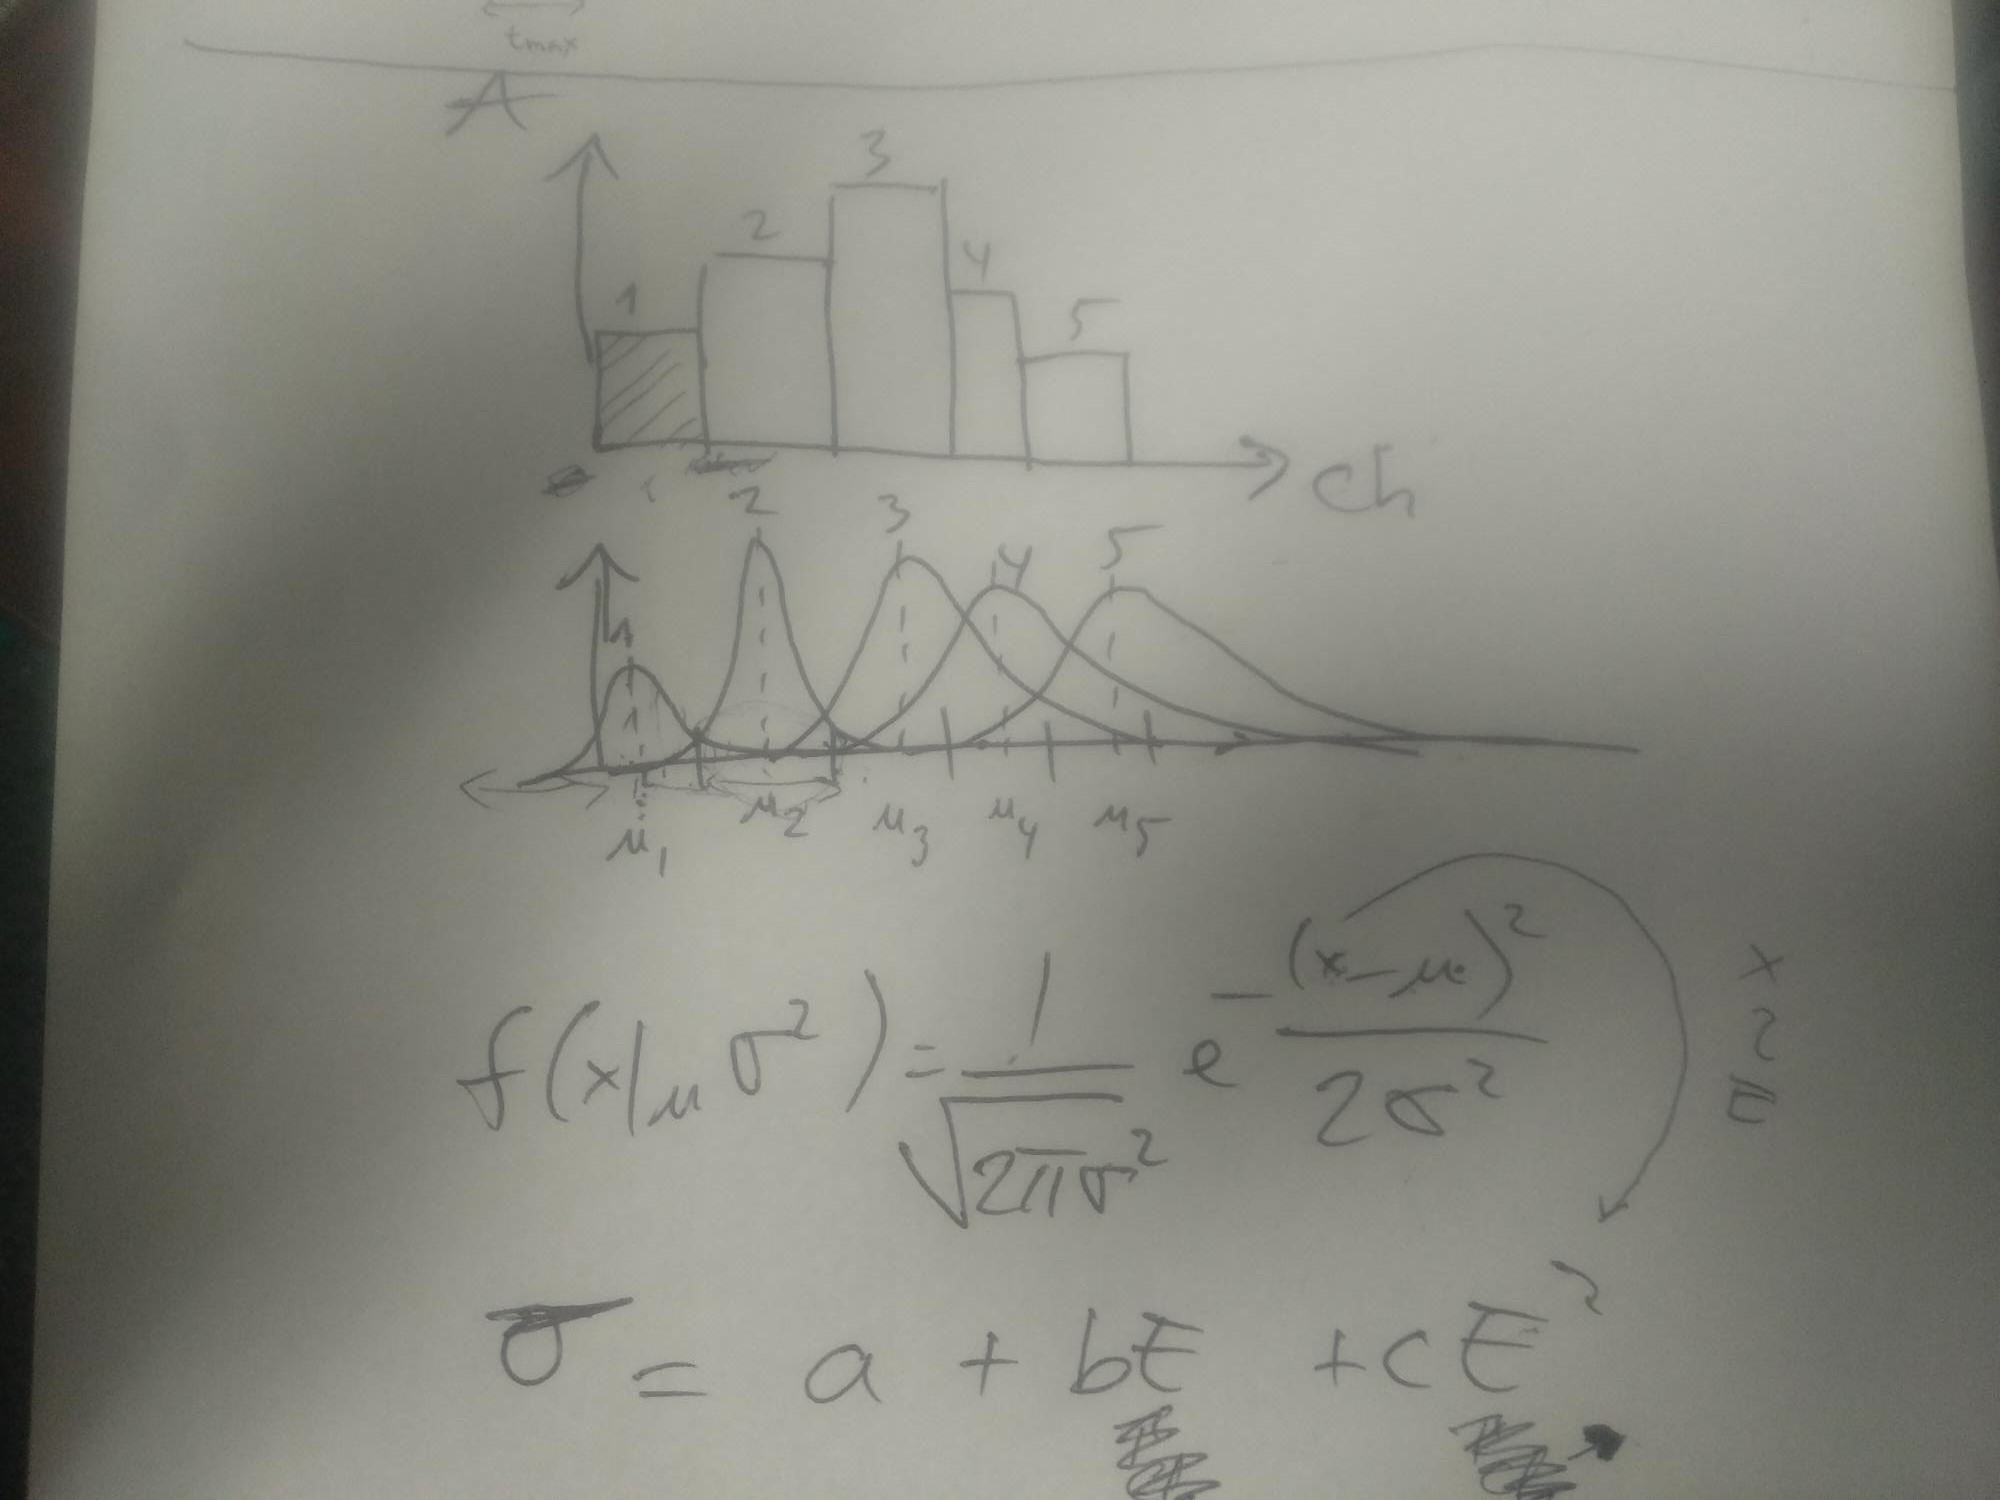
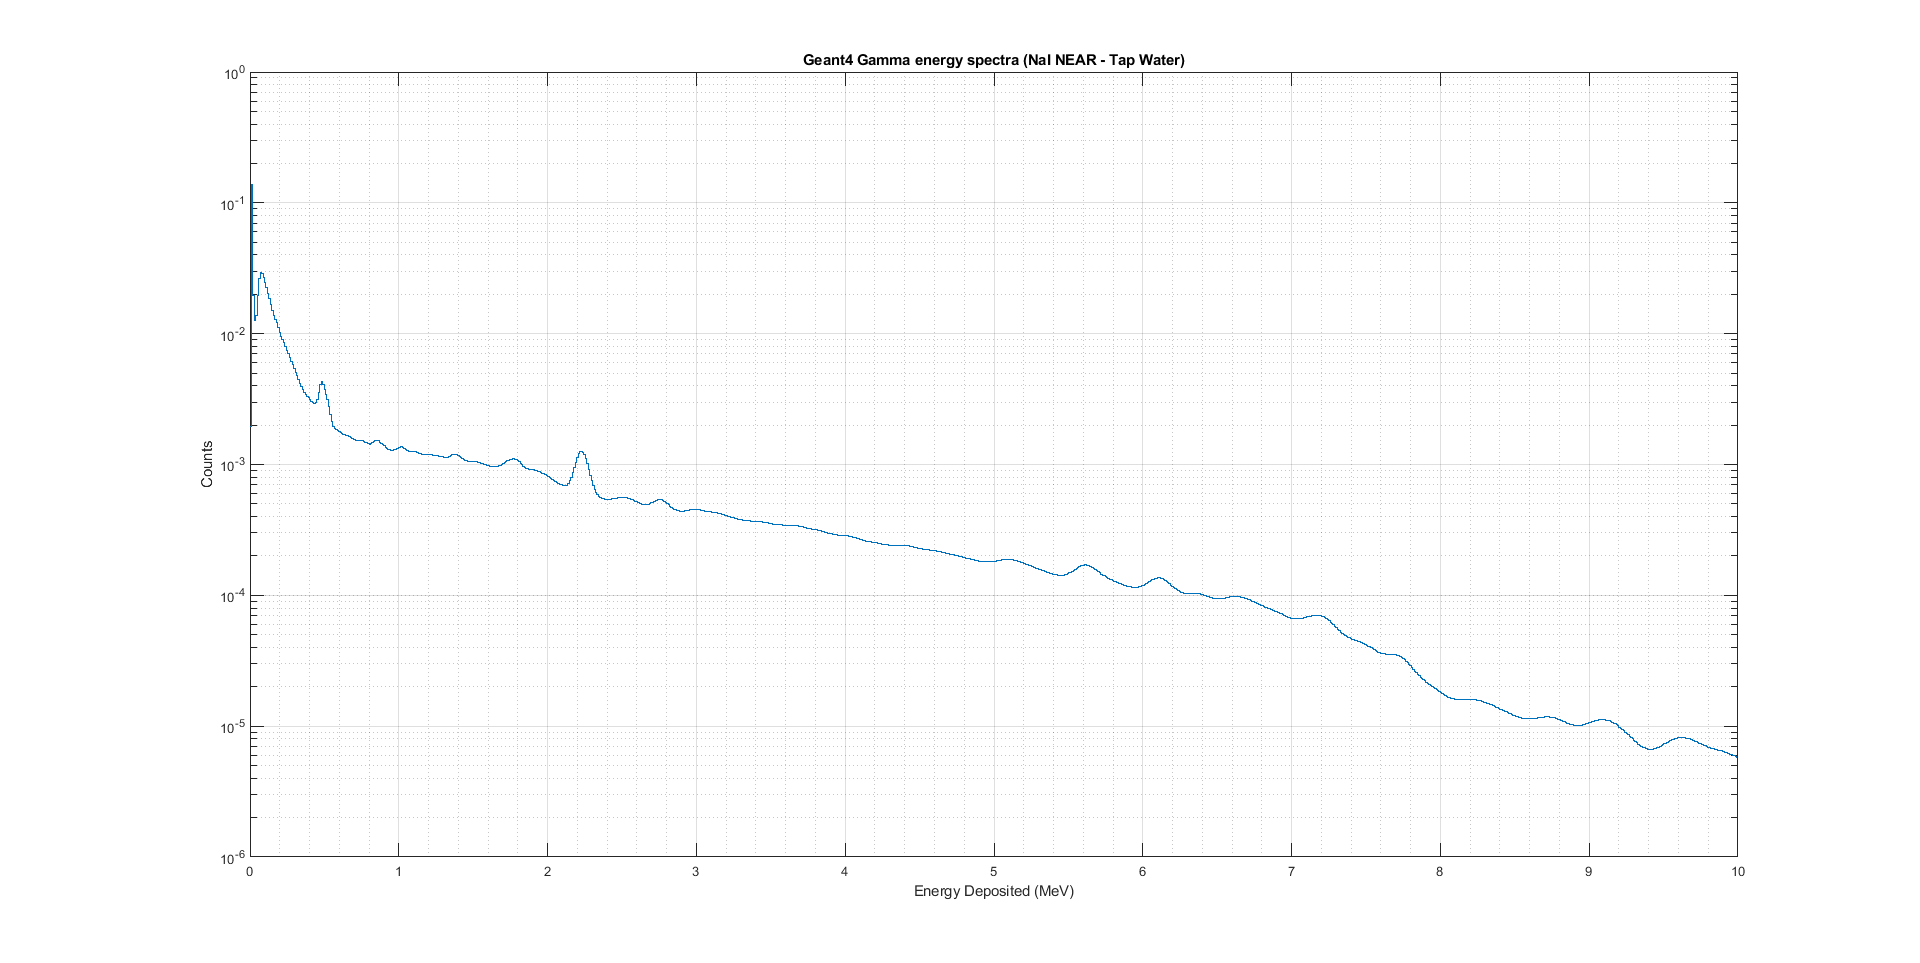
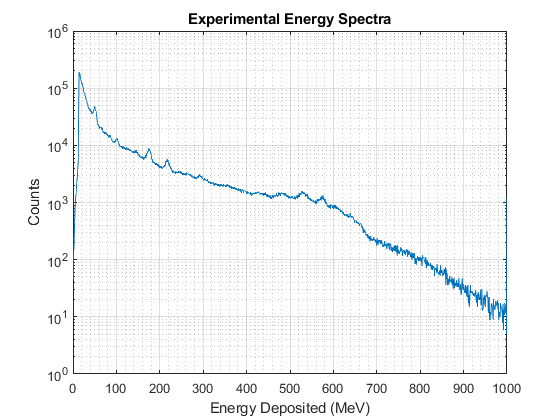
I am trying to perform a Gaussian broadening on an energy spectrum obtained from NaI detector. The final result should convert “specrum.png” to a similar form of “Exp.png”. The method is explained in the “snap.jpg”. In “snap.jpg” each bin is converted in a gaussian where the “μ” is the mean, and sigma of the gaussian is a polynomial function dependent on the energy i.e. x-axis (see code). Here each bin is converted to a Gaussian in a for loop and I want that the second bin gaussian includes a pileup from the Gaussian of the first bin. Similarly, the third Gaussian should include the pileup from second and first.
“W_NAIF.txt” is the data file which I want to process (Un-broadned spectrum).
The code I use to accomplish is “gaussianbroadning1.m”.
For some reason, the code does not work. Does anyone of you has written code for a similar purpose? If so, can you please share some guidance or a code sample. I realize this is not strictly a G4 related query, I have posted this on multiple forums and quite desperate for guidance.
The MATLAB code I am using is:
E=linspace(0,10,1026);    % Energy bins
for i=1:1026
    sigma(i) = (-0.00789)+(0.06769)*E(i) + (0.021159)*(E(i)^2);                          % Sigma polynomial function
    gaussFilter(i) = (1/sqrt(2*pi* (sigma(i)^2)))*exp(-((E(i)-0.5)))/(2*(sigma(i)^2));   % Gaussian function
    gaussFilter(i) = gaussFilter(i) / sum (gaussFilter(i));

    AAA=W_NAIF/sum(W_NAIF);

    newSPECU(i) = conv(AAA(i),gaussFilter(i));
end
figure(1);
stairs(E,newSPECU);
set(gca,'YScale','log');
xlabel('Energy Deposited (MeV)');
ylabel('Counts');
title('Geant4 Gamma energy spectra (NaI NEAR - Tap Water)');
grid minor;
grid on;
ylim([1 1e6])
%%
 W_NAIF.txt
 (4.3 KB)
Hi,
Generally my approach is as follows, but I don’t know if this is the correct way.
{
  std::ifstream readdat;//fstream
  readdat.open("W_NAIF.txt");
  if(!readdat.is_open())
    {
      std::cout<<"can't open file."<<std::endl;
    }

  TH1I *h1 = new TH1I("h1","",1026,0,10);//undroadened
  TH1I *h2 = new TH1I("h2","",1026,0,10);//droadened

  int data;
  double Ei;
  double sigma;
  for (int i = 0; i < 1026; ++i)
    {
      readdat>>data;
      cout<<i<<"  "<<data<<endl;

      for (int j = 0; j < data; ++j)
	{
	  Ei = (10.0/1026)*(i+gRandom->Rndm());
	  sigma = (-0.00789)+(0.06769)*Ei + (0.021159)*Ei*Ei;

	  h1->Fill(Ei);
	  h2->Fill(gRandom->Gaus(Ei,sigma));
	}
    }
  readdat.close();

  h1->Draw("");
  h2->SetLineColor(kRed);
  h2->Draw("same");
}
Hi, thanks for the reply! The issue is that, event the Hydrogen peak vanishes in this method. And the resultant spectrum looks nothing like the expected output.
Hi,
Are you sure the energy resolution is good enough? From the sigma formula you provided, I don’t think it can see any peaks.
‘sigma(i) = (-0.00789)+(0.06769)E(i) + (0.021159)(E(i)^2);’
Hi,
There was a minor correction in sigma = 0.424*((-0.00789)+((0.06769)*Ei) + ((0.021159)*Ei^2));
And that does give Hydrogen peak. But is is too broader than it shoul be
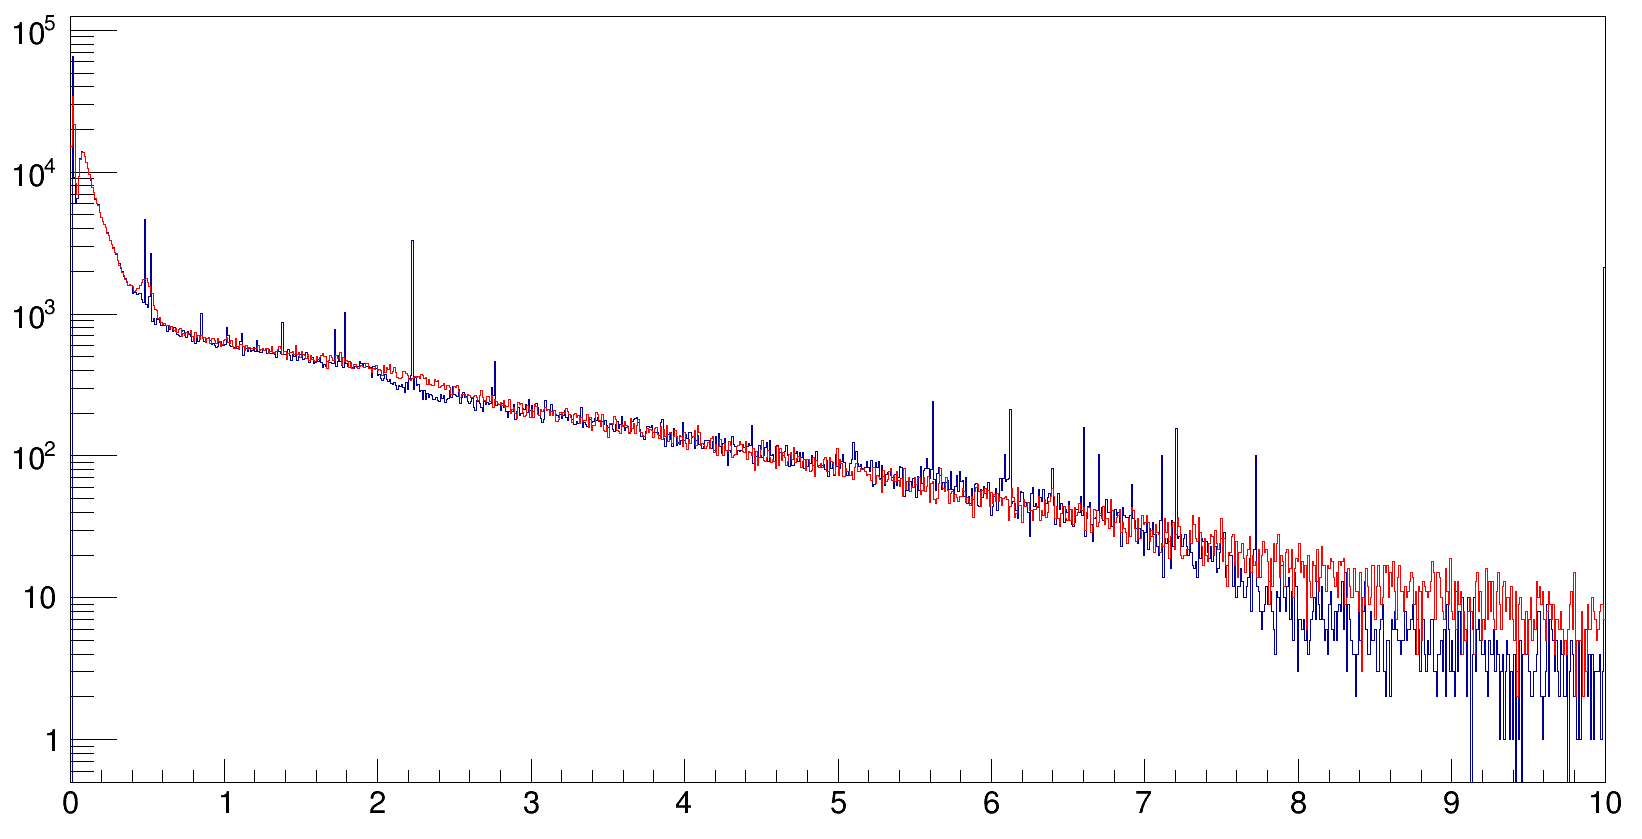
I worte code in matlab it gives me perfect response.
I am also interested to know what can be posible improvements in ROOT code to get similar response.
Thanks!
THIS IS MATLAB RESPONSE.
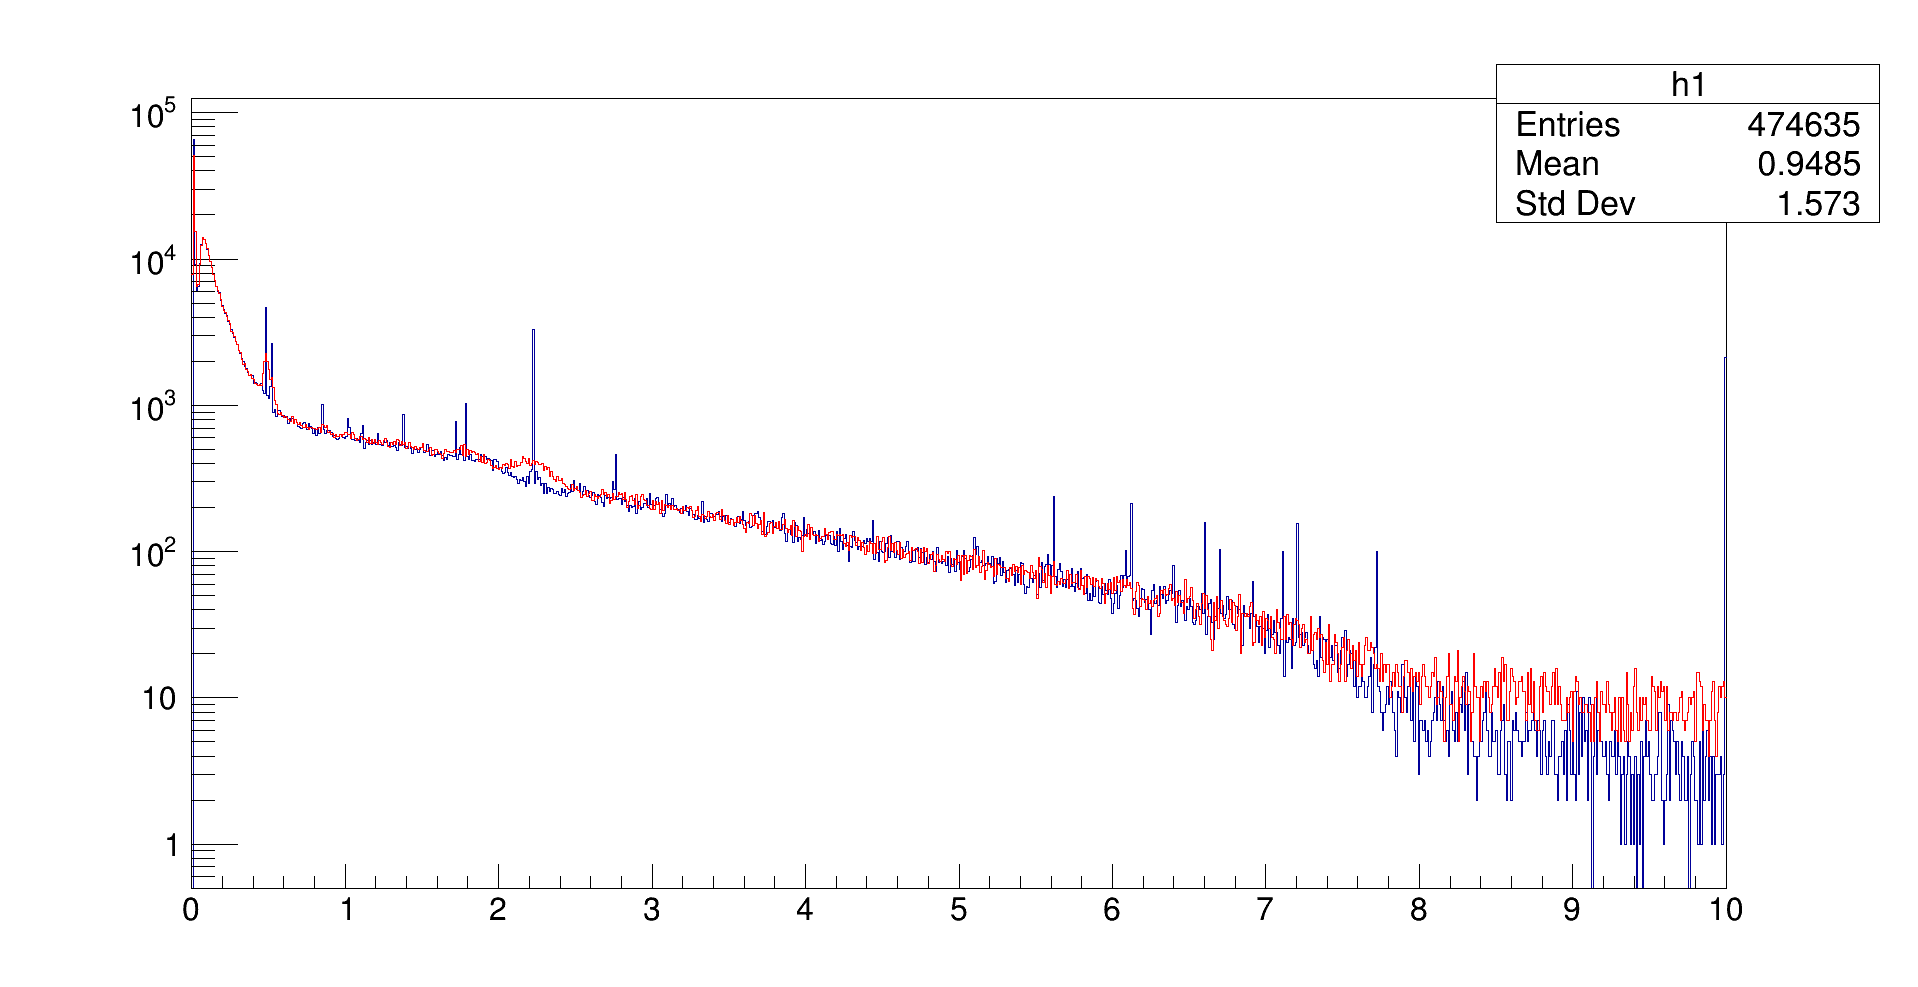
THIS IS ROOT:
Hi,
Sorry, I don’t understand the meaning of your formula. I think the gaus convolution I understand is different from what you said.
for i=1:1026
    sigma(i) = (-0.00789)+(0.06769)*E(i) + (0.021159)*(E(i)^2);                          % Sigma polynomial function
    gaussFilter(i) = (1/sqrt(2*pi* (sigma(i)^2)))*exp(-((E(i)-0.5)))/(2*(sigma(i)^2));   % Gaussian function
    gaussFilter(i) = gaussFilter(i) / sum (gaussFilter(i));

    AAA=W_NAIF/sum(W_NAIF);

    newSPECU(i) = conv(AAA(i),gaussFilter(i));
end
Can you explain above code for me?
Let’s change our mind to try to understand this difference. In the following formula, when Ei=7MeV, sigma is 0.64MeV. We imagine a peak at 7MeV with FWHM of 1.5MeV, which would be fatter. It should not be what you show in the picture.
sigma = 0.424*((-0.00789)+((0.06769)*Ei) + ((0.021159)*Ei^2));
Hi,
Below is the complete code I used to broaden my spectra:
numEbins = 1026;
E=linspace(0,10,numEbins);    % Energy bins
W_NAIF_G(1:numEbins,1)=0;
for i=1:(numEbins)
    sigmaFilter = 0.424*((-0.00789) + (0.06769)*sqrt(E(i) + (0.021159)*(E(i)^2)));

    gaussFilter = (1 / sqrt(2* pi * (sigmaFilter^2))) * exp(-((E-E(i)).^2)/(2*(sigmaFilter^2)));

    W_NAIF_G(i) = sum((W_NAIF').*gaussFilter);
end
I have made a lot of correction in my formula in code.
Thanks!