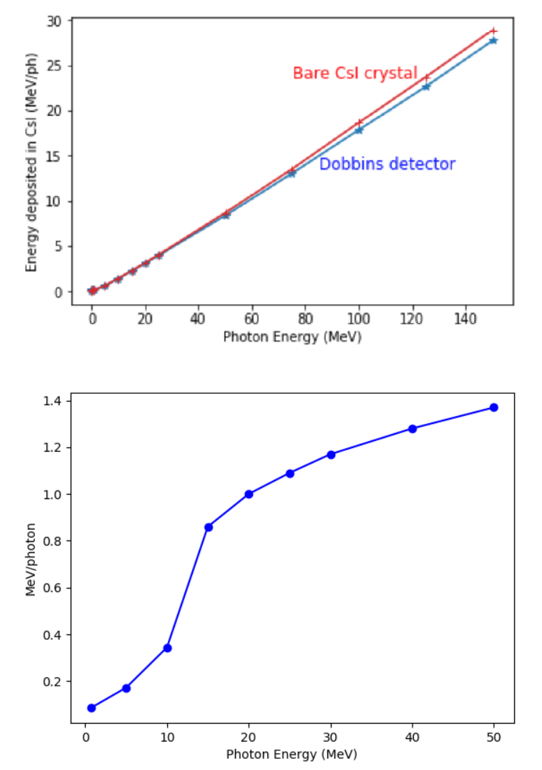
Hello, I have spent the past month and a half trying to get Geant4 to agree with a simple test done in MCNP6.I have been trying to recreate the first plot in the image given below, where the model is simple. A circular, monoenergetic photon source of radius .6 cm is placed .5 cm away from a 1 cubic centimeter Cesium Iodide cube, and the direction of the photons are normal to the surface of the cube. The energy deposited on the cube in MeV/photon is plotted versus the photon energy. I am using the QGSP_BERT_EMV physics list, my scoring volume is done via a macro and calculates eDep on the CsI cube. The issue is that Geant4 is giving me the following distribution which is the second plot in the image below. To get straight to the point, at high photon energies, Geant4 is underestimating the energy which is deposited on the cube. Now, I have tried numerous different physics lists which contain the standard electromagnetic processes, different methods of scoring, and playing with G4StepLimiter to change the maxStepLimit in the cube, but after a month I am still clueless as to what I am missing that is causing Geant4 not to match MCNP6 and get this nice linear relation, whether it is a blatant or subtle issue. I have also tried doing a simulation of mass-energy absorption coefficients of CsI to match with NIST at 20 MeV, and Geant4 again underestimated the energy deposited on the cube, however the absorption coefficient did match nicely with NIST at .6 MeV. Any insight that may help me identify what’s going on would be greatly appreciated!
Hi! I came to the same result, trying different physics lists and got nothing. But i my case the curve a little bit different from yours (in range up to 20 MeV). I used geant4.10.5 and QGSP_BIC pl for this plot. And to calculate the energy deposition I used sensitive detector as CsI volume.
Thanks for your observation! I am using Geant 10.2. Perhaps there is some sort of physical process that must be manually enabled that is causing this flattening in the curve.
Hi again! Maybe there should be included scintillation process to CsI material to get good comparision? Because by default scintillation process is not taken into account.
Hi, I think that is certainly a possibility. I will investigate this over the next few days, and post my findings here. Thanks for the suggestion!
Hi Aleksei,
I wanted to point out that I have tried conducting this same simulation but with lead, and am receiving similar results, where the energy deposited per photon at higher energies is still not linear. This leads me to believe that the issue may not be scintillation, and I am also aware that scintillation in Geant is not the most straight-forward process to implement. Lastly, I wanted to point out that the plot which was obtained in MCNP uses an F6 tally, which is a method that measures energy deposited based on collisional heating, which I do not think includes scintillation.
Hi! I agree with you. Yesterday I icluded scintillation process in that simulation and doposited energy from scintillation was very small and I think it is not worth to take into account this praction of energy. Could you please show the plot from MCNP of deposited energy in case of using 1 cudic centimeter lead to compare that with geant4?
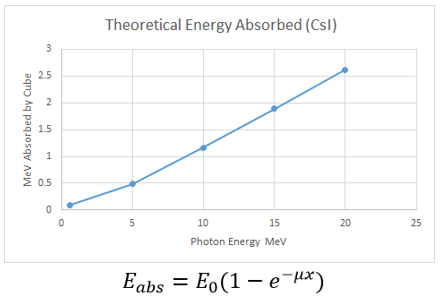
Hi Aleksei, apologies for the delayed response. Unfortunately, I have no experience using MCNP. The MCNP plot which I am comparing with Geant was created a few years ago by another lab member. It may be worth noting that using the online NIST database for various attenuation coefficients, one can make a plot of the energy deposited per photon as a function of photon energy using the NIST coefficients for Cesium Iodide. I have attached one that I have made myself below. Note, E_0 is the photon energy, u is the mass-energy absorption coefficient from NIST at that energy, and x = 1 since I am interested in a cube of 1 cm thickness. NIST only has these coefficients up to 20 MeV on their website, so I have only gone up to 20 MeV, though it still seems that the “correct” distribution is in fact a linear one, at least for CsI. Furthermore, I recently read a paper comparing Geant and MCNP which stated that MCNP internally uses NIST coefficients for some of its energy calculations, which would explain why it matches nicely with the linear distribution. I am confident that Geant should be able to match this since it is used so widely, I just cannot seem to figure out what is missing.
For anyone interested, i found this paper which matches Geant4 data to NIST coefficients successfully even at higher energies, but using Geant 6.2.
Try using the physics list constructor for fiber grained control of which em physics list is used instead of the pre-defined physics list. Here is an example of using the physics list constructor: https://gitlab.cern.ch/geant4/geant4/-/blob/master/examples/extended/parallel/ThreadsafeScorers/src/TSPhysicsList.cc#L105
Also, make sure you are adding the G4StepLimiter to a volume and enabling it in the physics list – in order for it to actually be applied, you have to do both.
Thanks so much for the suggestion. I will try implementing this and let you know if it solves my issue.
Hi! I start to think that there is a some bug in the program. Because this process is so common that it should work in any physics list. Maybe it worth to open a bug report? Especially because you found the article where simulation data and experemental have a good agreement. Or I hope someone from developers will tell what wrong.
Hi jrmadsen, I tried implementing your physics list in my program, using the step limiter as you have and using only the EMStandardphysics constructor, and yet I still am not getting as much energy deposited on the CsI cube per photon as I should be compared with MCNP6, I am still stuck at about 1.6 MeV/ph which is about what I was at with my pre-defined physics. I very much appreciate your help, I am thinking of reaching out to a developer.
Hi Aleksei, as per your suggestion, I have submitted a bug report. I will update this post once they respond.
Vladimir and Daren are the maintainers for the EM physics. They probably can provide you with some insight. @civanch @dsawkey
Thank you. Hopefully they will respond here.
I don’t think the first plot shows what you think it does. The detector volume is only 1 cc and many secondaries will leave the volume. Values of the mass energy absorption coefficient assume charge secondaries deposit energy in the material.
Try some numbers. At 50 MeV NIST shows mu en/rho = 0.04 cm2/g and mu/rho = 0.07 cm2/g. With rho = 4.5 g/cm2 this gives mu_en = 0.18 /cm. With dx = 1 cm and E = 50 MeV,
dE = - mu_en E dx = 9 MeV
In your first (MCNP) plot, dE at 50 MeV is 9 MeV. Thus, the MCNP is not taking account any secondaries leaving the detector. Geant4 is telling you there are secondaries leaving.
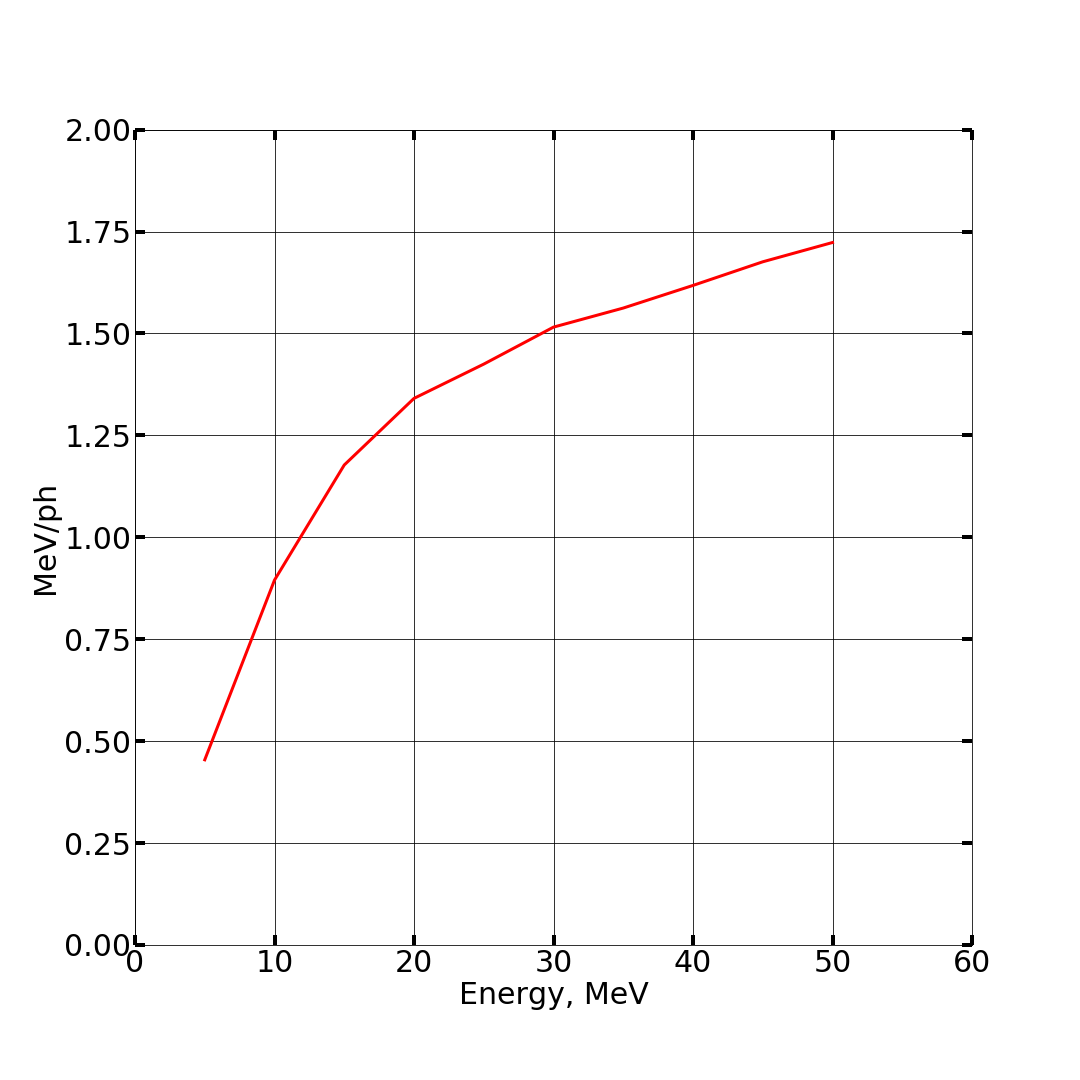
Thank you so much for your explanation, it is tremendously appreciated. In response to your insight, I have added a very high production cut to gammas to try and increase the energy deposited in my Cesium Iodide cube as much as possible and was able to obtain the following plot.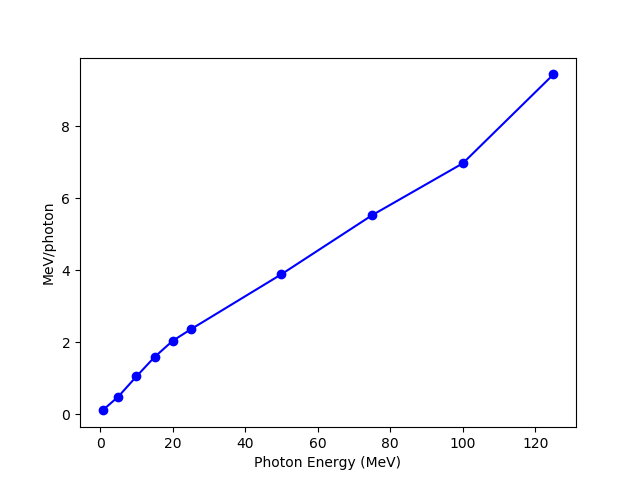 Fortunately it is modestly linear, though this is still off from the original plot in MCNP by about a factor of 1/2 at most data points. I will continue investigating setting cuts and see if I can further get the MeV deposited/photon to increase.
Hi jpjpjp4747,
I agree with dsaweky, the first plot from MCNP6 is really suspicious.
It is a bit optimistic to expect that a 1 cm3 crystal will be able to contain an electromagnetic shower at 150 MeV. Ok, it’s just impossible. The Geant4 plot is much more logical than the linear dependence obtained with MCNP. At low energies, <500 keV the photon interactions are dominated by the photoelectric effect and most of events will result in a full energy deposition in a 1 cm3 CsI. When you move up with energy, Compton scattering starts to dominate. At 1 MeV you will have mostly partial energy deposition due to Compton scattering. Additionally, CsI is not very high density material, it won’t have an impressive photofraction in general (compared to PWO, BGO, LSO etc.). At around 10 MeV pair production kicks in, and your energy deposition per photon increases (and this is exactly what your G4 plot shows). Above 20 MeV things start to level out because a small 1 cm3 crystal cannot contain an electromagnetic shower which develops.
You can make your plot more linear by making CsI crystal larger. An infinitely large crystal will eventually stop any energy photon and you will get your linear dependence. I would advise to return to the standard em physics list and increase the crystal size to 1 meter.
Cheers,
Weronika
Hi Weronika,
Thank you for your thorough explanation. I have been looking into it, and it seems like the MCNP “tallies” which use collisional heating to measure energy deposition, such as the F6 and *F8 tallies, assume that “All energy transferred to electrons is assumed to be deposited locally” (MCNP Manual). This is in agreement with dsawkey’s statement that MCNP, as well as the mass energy absorption coefficients from NIST, make this same assumption (that no secondary charged particles leave the volume, they deposit all of their energy locally). If this is unphysical as you describe, do you have any ideas as to why people using MCNP would use this assumption for their dose calculations?
Best regards,
Joseph