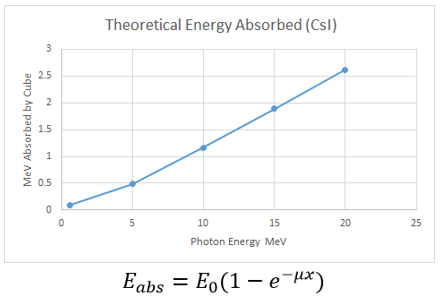
Hi Aleksei, apologies for the delayed response. Unfortunately, I have no experience using MCNP. The MCNP plot which I am comparing with Geant was created a few years ago by another lab member. It may be worth noting that using the online NIST database for various attenuation coefficients, one can make a plot of the energy deposited per photon as a function of photon energy using the NIST coefficients for Cesium Iodide. I have attached one that I have made myself below. Note, E_0 is the photon energy, u is the mass-energy absorption coefficient from NIST at that energy, and x = 1 since I am interested in a cube of 1 cm thickness. NIST only has these coefficients up to 20 MeV on their website, so I have only gone up to 20 MeV, though it still seems that the “correct” distribution is in fact a linear one, at least for CsI. Furthermore, I recently read a paper comparing Geant and MCNP which stated that MCNP internally uses NIST coefficients for some of its energy calculations, which would explain why it matches nicely with the linear distribution. I am confident that Geant should be able to match this since it is used so widely, I just cannot seem to figure out what is missing.