Hello!
I want to get physics process associated with a scintillating process and then get energies deposited by photoelectric effect, compton effect etc. But when I wrote my code to get the process name, it is only showing “transportation process”. How can I get the EM process happening in the process of scintillation.
const G4Track* aTrack = aStep->GetTrack();
G4String processName = aStep->GetPostStepPoint()->GetProcessDefinedStep()->GetProcessName();
G4cout<<"process name: "<<processName<<G4endl;
It is giving me-
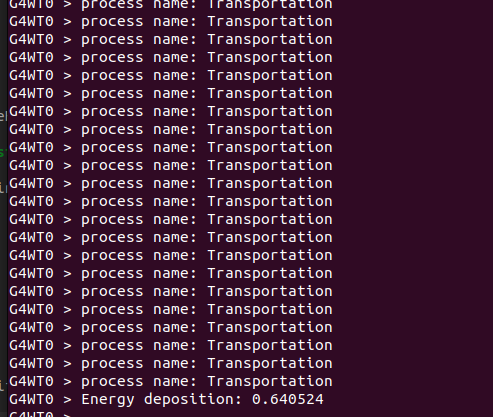
Any sort of help will be appreciated.
Thank you so much
Are you only seeing transportation as the process name, and do you have any conditionals on your detector so you only see the primary particle?
If you don’t have a conditional I would imagine that you are likely seeing the steps take by the secondary electrons. The number of steps taken by the secondary electrons can really add up, from what I have observed in my simulations the number of steps taken in total by the secondary electrons for a full energy deposition of the primary is around 200, additionally you may be seeing the traveling steps taken by the scintillation photons if that is turned on.
I use the following snippet of code in my detector.cc file so that I only see primary particle interactions.
if (track->GetTrackID() == 1) {
    man->FillNtupleIColumn(0, 0, G4RunManager::GetRunManager()->GetCurrentEvent()->GetEventID());
    // If Photoelectric save 1
    if (PostProcessName == "phot") {
        man->FillNtupleIColumn(0, 1, 1);
    }
    // If Not photoelectric save 0
    else{
        man->FillNtupleIColumn(0, 1, 0);
    }
    man->AddNtupleRow(0);
}
The if statement on get track ID lets me know if I am dealing with a primary or not, the rest of the code you can ignore and instead save your interaction type and the event ID.
Dear Keith
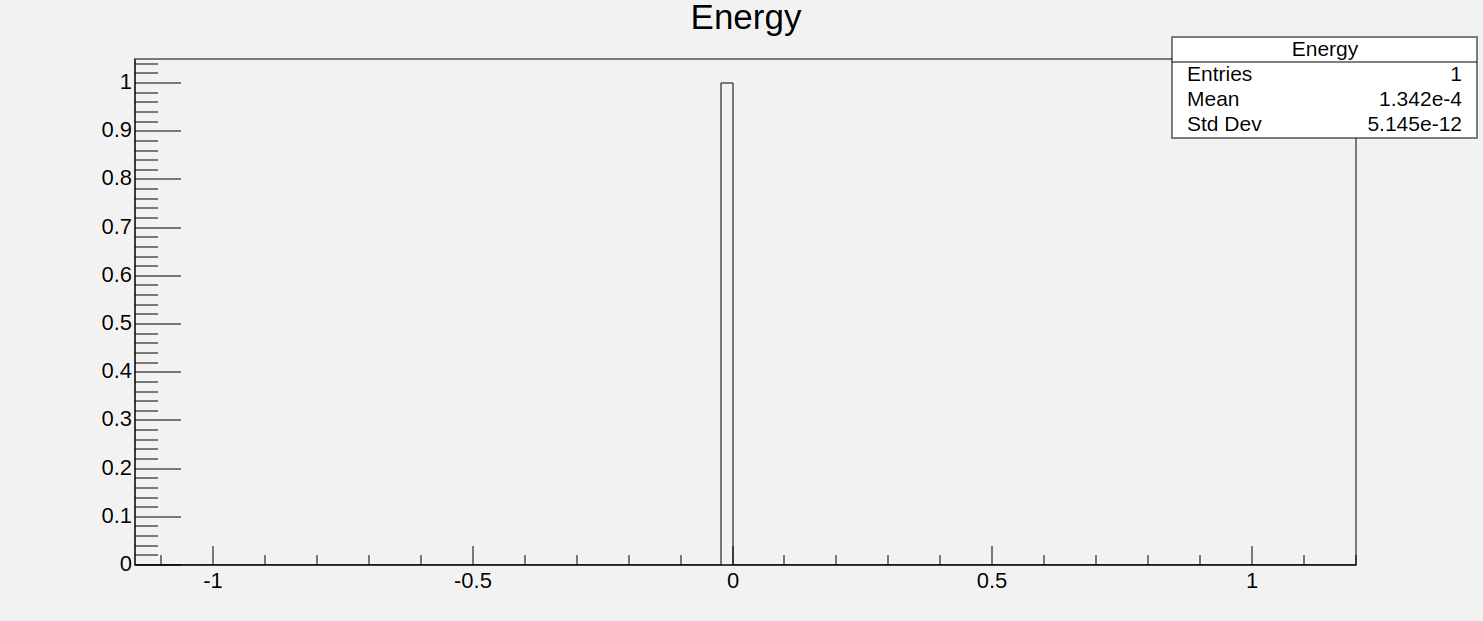
Thank you so much for your response. Method you suggested helped me in getting energy deposited by photoelectric effect. But the plot in root file is bit weird. It is showing plot for 1 entry only, how can we get it for multiple entries.
Regards
What is your source description, and how many primaries are you generating? I assumed you were simulating a beam source but if you are looking for the energy deposition of secondary gammas then that may be a reason why you only get one entry in your output.
Now if you are looking for energy deposition of all gammas, not just those generated by your source description, then you could change your if statement to
G4Track *track = aStep->GetTrack();
G4ParticleDefinition* particle = track->GetDefinition();
const G4String& particleName = particle->GetParticleName();

if (particleName == "gamma") {
   // Record Data
}
Thank you so much for your reply Keith.
My source is single gamma ray of 1 MeV energy which generate scintillation photons in the scintillator, not secondary gamma. Keeping event numbers aside, I wanted to obtain plot of photon count v/s energy. How can I do that ?
If I had to guess it looks like you only had one event in your run, are you sure that your run has multiple events and not one?
I have got multiple entries when I run the simulation for like 50 times using /run/beamOn. Now I am working on photon count plot. Can you kindly tell how we adjust the x and y axis of nTuple in ROOT. I think this way I could get my plot.
I want graph similar to what you posted as question here: Counting optical photons from scintillation events
Kindly help!
Thank you so much
Sorry I am not well versed in ROOT, I send my results to a .txt file and then use R, or Python to handle the remaining data processing.
However, as I understand the plot you posted earlier, I see that there is only one entry in your histogram so I don’t think changing your x and y-scale will solve your issue. My concern is that you ran “/run/beamOn” and input this command 50 times. Every time you use “/run/beamOn” a new output file is generated and will overwrite the previous one, so in reality you would have 1 history in your output file not 50.
So if you wanted more histories in your histogram instead use “/run/beamOn 100”, I put 100 here but just replace that with the number of histories you want.
Thank you so much for your reply. Can you tell me how to transferred your data to a txt file ?
Thanks
I essentially do what this fellow does in the video Geant4 Tutorial 8: Storing Hits in ROOT File - YouTube except I use a G4CsvAnalysisManager.
Did you try using “/run/beamOn 100” with ROOT though? I would have thought that would have solved your issue.
oh! thank you. I will try implementing what he is explaining.
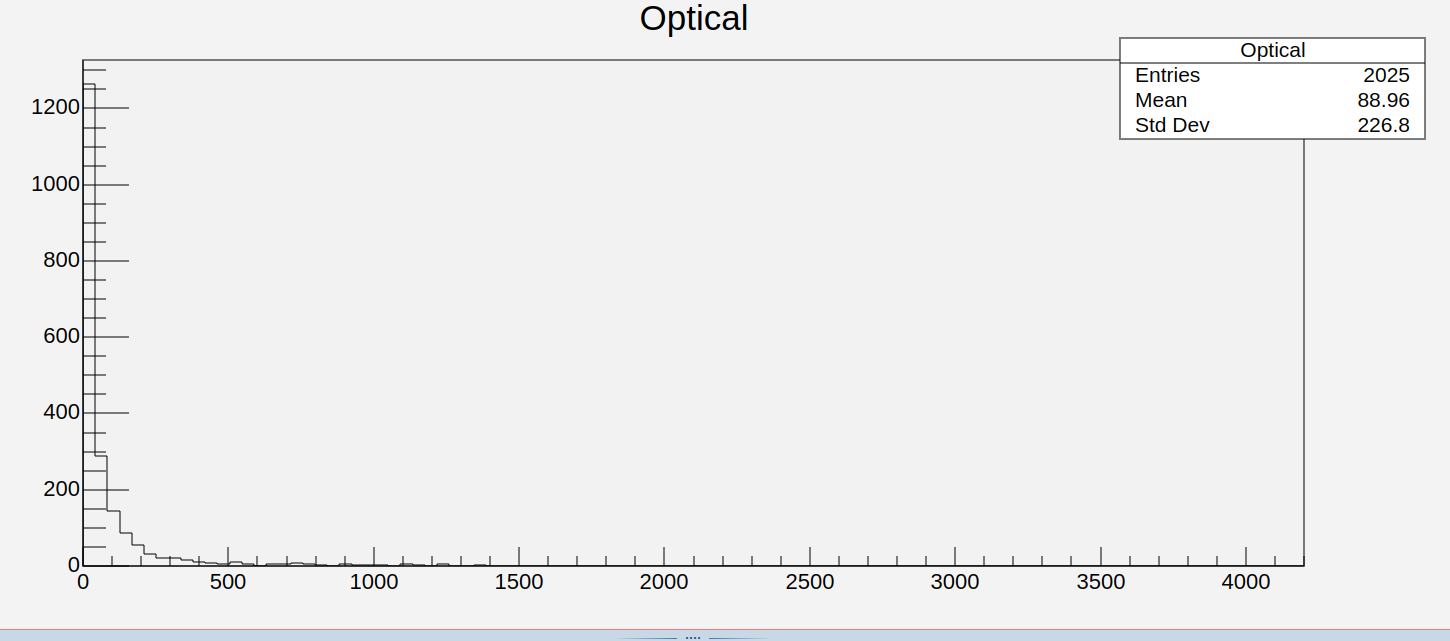
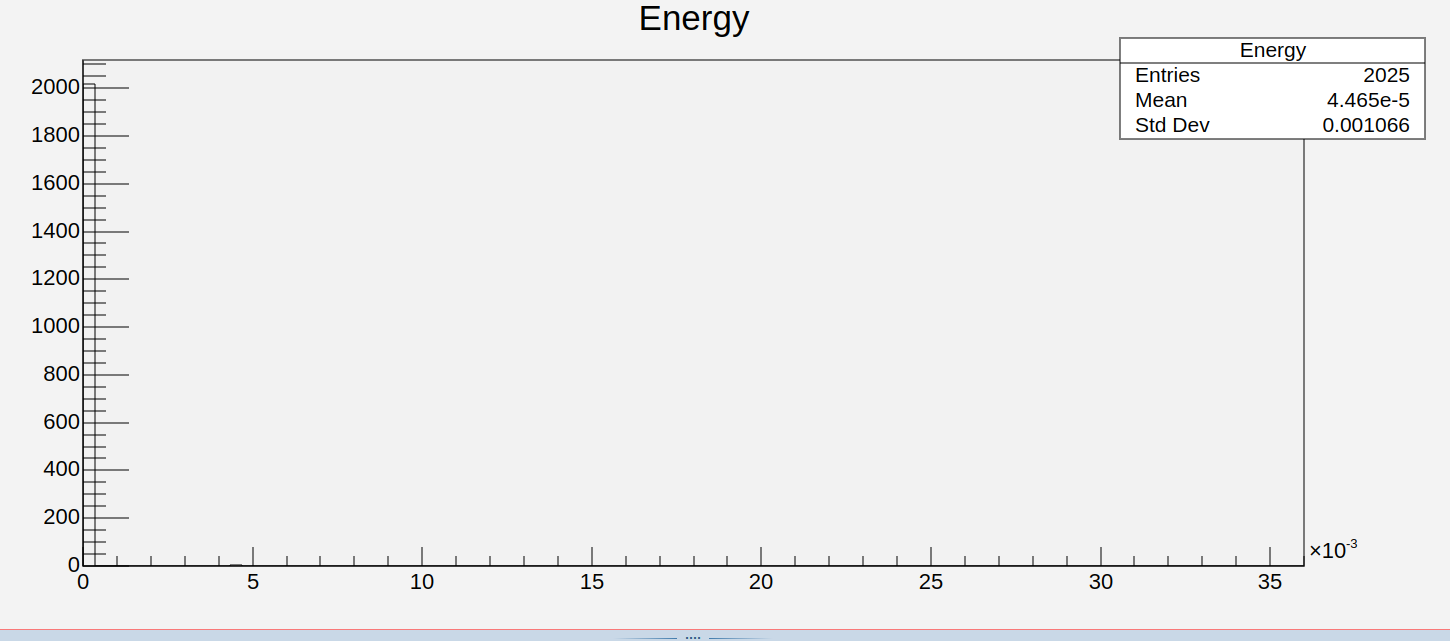
And yes I tried with 100 beams but the plot I am getting is between energy and event i suppose. I am attaching images for references.
this one is for optical photon count
this is for photoelectric energy deposition
I want to plot graph between number of optical photons and incident energy. So that’s why I was getting confused in ROOT framework.
hello Keith
I ran into one more issue with the simulation. I calculated energy deposition due to photoelectric effect and the number of photons ejected. I found that more number of photons are ejected for less amount of photoelectric absorption. Can you tell what is the issue.
Thank you so much
  if (track->GetTrackID() == 1) {
  G4AnalysisManager *man = G4AnalysisManager::Instance();

    if (PostProcessName == "phot") {

    G4double edep = aStep->GetTotalEnergyDeposit();
    fEventAction->AddEdep(edep);

    }
    // If Not photoelectric save 0
    else{
        G4double edep=0;
    }

}
  else if (particleName == "e-") {
   G4AnalysisManager *man = G4AnalysisManager::Instance();
        G4int numoptical = 0;

            // Now start counting the number of secondary optical photons

            // Loop through all secondaries
            for (int i=0; i<secSize; i++){
                G4String secondaryName = (*secTrack)[i]->GetDefinition()->GetParticleName();
                // Increment counter if secondary is an optical photon
                if (secondaryName=="opticalphoton"){
                    numoptical = numoptical + 1;

                }
            }


            man->FillNtupleDColumn(0, numoptical);
            man->AddNtupleRow();

     G4cout<<"no of  photons: "<<numoptical<<G4endl ;
It could possible be how you are post processing your data, could you upload your data, and the plot that you observed this trend in? Hard to say exactly what it could be without a bit more information.
Also what energy region are you testing this in?