hi I’m using the Geant4 Activation example.
The example graphs the activity of neutrons, protons, mesons, gamma…
But I want to know how to graph the activity of the Bi209 isotope.
I am running the Bi209.mac file
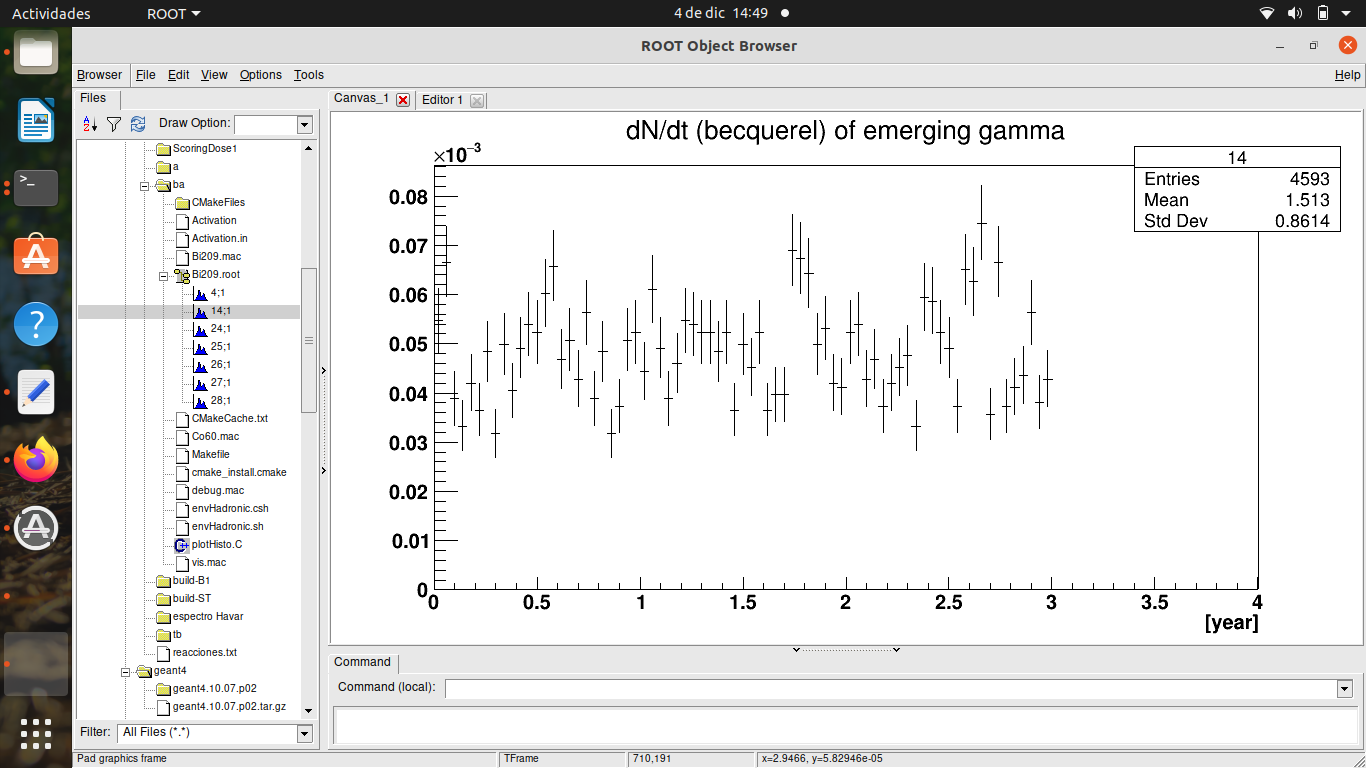
I want to do something as shown in the picture but for isotopes