Geant4 Version: v11.3.0
Operating System: macOS Sequoia 15.2
Compiler/Version: v16.0.0
CMake Version: v3.31.2
Hello! I’m new to using Geant4 and was hoping to get some clarification on the energy spectrum of the particles that my simulation is producing, especially in comparison to a similar spectrum produced using Pythia. My current Geant4 setup uses the FTFP_BERT physics list and models a 120 GeV proton beam incident on a beam dump made of iron. The resultant particles’ energy and momenta are then recorded in a .csv file by a detector placed after the beam dump. My questions are as follows:
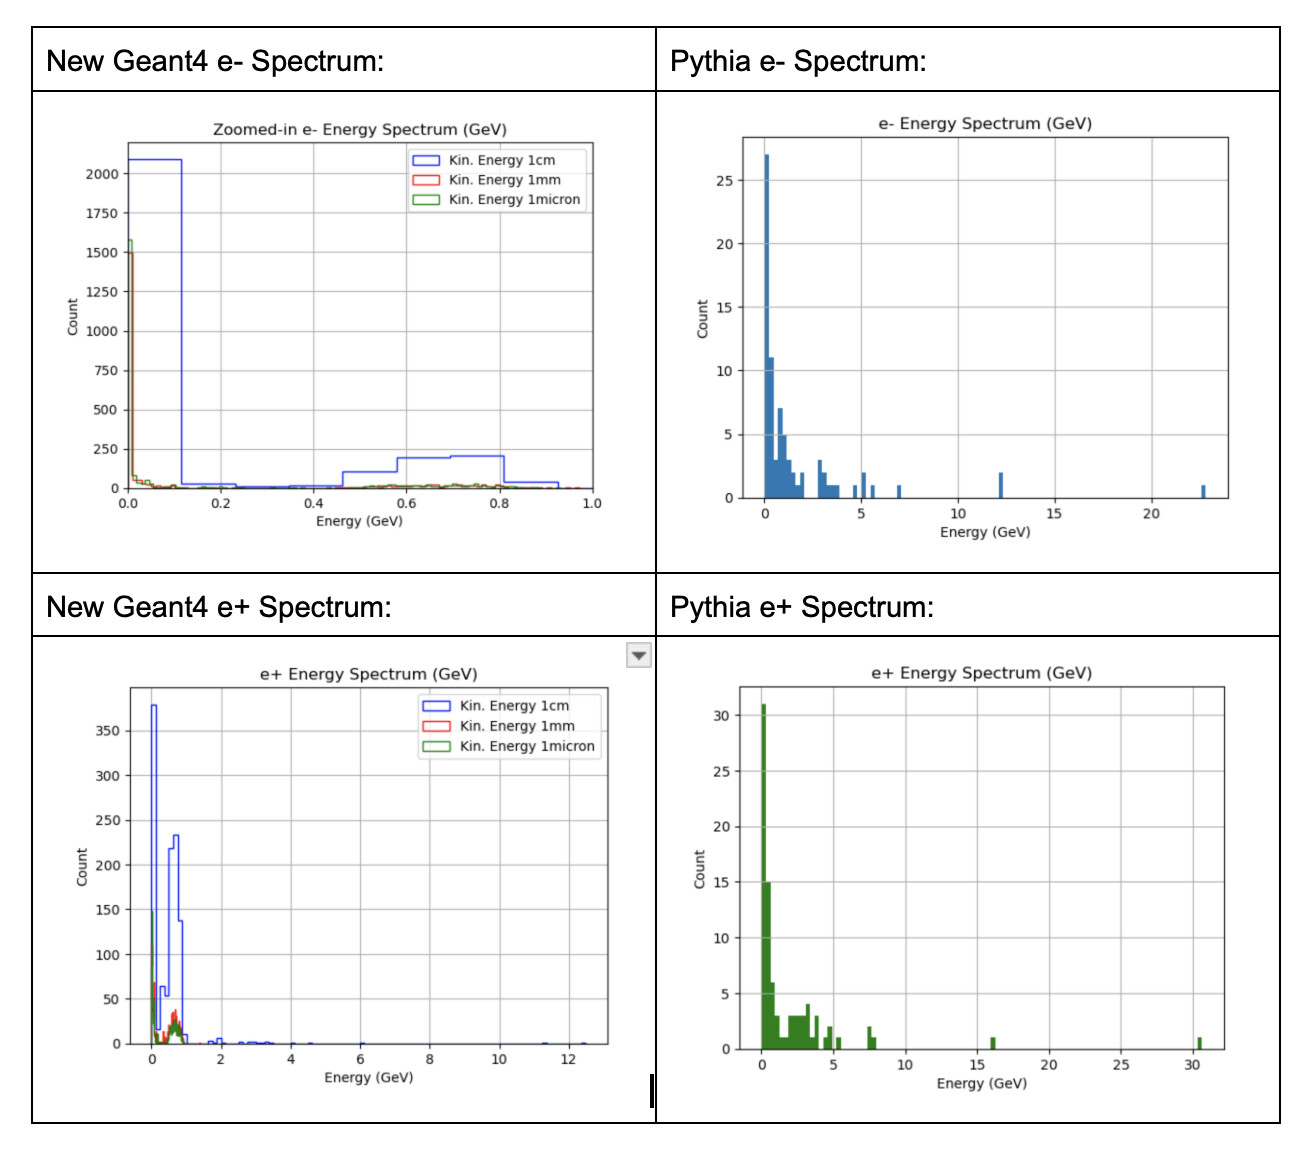
- When compared to a similar simulation using Pythia, the e- and e+ energy spectra produced by Geant4 was found to be significantly different–with two large peaks instead of one and biased towards a significantly lower energy range than the Pythia output, as can be seen in the below plots. Even when the thickness of the beam dump was changed to mimic the proton-proton interaction modeled using Pythia (we assumed the two peaks were a result of showers being produced), the same behavior persisted. Why are the energy spectra so different between the two different simulation software, and what can I do to resolve the discrepancy?
- When observing the output from the Geant4 simulation, a large number of just the simulated electrons were recorded as having 0 energy and momentum by the detector. These have been removed in the above spectrum, so they aren’t what is causing the first peak, but they’re still strange. Why were so many of the detected electrons found to have no energy/momentum?
Please let me know if anyone has any insight into either of these problems! I’m happy to provide any other information that might be useful, or to provide more clarification if needed. Thanks!
We really would have to see how you are scoring/recording the energy deposited in your detector. Large numbers of unexpected zero bin counts tends to be one of two things in Geant:
- Geant will happily follow particles until the end of time so extremely low energy particles that might have realistic time cutoffs in other scenarios will be recorded anyway and thus make it to your detector on absurd time scales.
- Energies are being recorded for a particle for each event regardless of if they interact with your detector or are generated at all. In the real world you don’t ever get to know the particles that never make it to your detector. This often means a lot of zero values that then make it into your zero bin.
Hi–thank you so much for responding so quickly! I’ve posted the code that I use to record the energy below. If you have any further insight I’d greatly appreciate it!
G4bool MySensitiveDetector::ProcessHits(G4Step *aStep, G4TouchableHistory *ROHist)
{
    G4Track *track = aStep->GetTrack();

    //particle name stuff:
    const G4DynamicParticle* dynamicParticle = track->GetDynamicParticle();
    G4ParticleDefinition* particle = dynamicParticle->GetDefinition();
    G4String particleName = particle->GetParticleName();

    //momentum stuff
    G4double E_tot = track->GetKineticEnergy();
    G4double p_x = track->GetMomentum().x();
    G4double p_y = track->GetMomentum().y();
    G4double p_z = track->GetMomentum().z();

    G4cout << "Particle Name, 4-mom.: " << particleName << ", " << "(" << E_tot << ", " << p_x << ", " << p_y << ", " << p_z << ")" << G4endl;

    G4AnalysisManager* analysisManager = G4AnalysisManager::Instance();
    analysisManager->FillNtupleSColumn(0, 0, particleName);
    analysisManager->FillNtupleDColumn(0, 1, E_tot);
    analysisManager->FillNtupleDColumn(0, 2, p_x);
    analysisManager->FillNtupleDColumn(0, 3, p_y);
    analysisManager->FillNtupleDColumn(0, 4, p_z);
    analysisManager->AddNtupleRow(0);

}
I think I see the possible issue. But first, is the world air or vacuum? If it is vacuum then I suspect you have issue (1) and so if you also record the global time you can filter that out.
More to the point is that your process hits function is evaluating for every step inside the volume. So for every electron you are getting its kinetic energy at its initial incident energy down to zero as it slows down (same with positrons). It is likely you are dramatically overcounting low energy events. Try saving the track ID and event ID. You’ll likely see this.
Do you want to record the total energy deposited or the initial energies? Those are two different tasks. GetTotalEnergyDeposit() helps with the former instead of GetKineticEnergy(). The latter will likely require some finesse if you want to use ntuples.
Hi–thank you so much for clarifying things–that makes a lot of sense! To answer your first question, the world volume is air. And for the second, ideally I would be able to record the kinetic energy of the particle when it first hits the detector and save it to a .csv file for further analysis. Do you know how to do something like that, schematically? Are there any examples that I could reference that do something similar? Thank you so much for all of your help!
The cleanest way to record the kinetic energy as the particle enters the volume is with checks that require passing the volume of interest or using G4RegionStore or RunManager, etc to the stepping action or hits class. You can even try to use string comparisons if you want. Then accessing these two parameters with the current step:
G4LogicalVolume* post_volume = step->GetPostStepPoint()->GetTouchableHandle()->GetVolume()->GetLogicalVolume();
G4bool boundary = step->GetPreStepPoint()->GetStepStatus()==fGeomBoundary
Then its one boolean statement (let’s call your target volume target_volume):
if ((post_volume == target_volume) && (boundary)){
   KE = step->GetPostStepPoint()->GetKineticEnergy();
   # Record and process that KE here
}
The first clause checks that the next step is in your volume. While the first step will check that you encountered a boundary. All steps make at least 1 step at boundaries. So combined you have all you need. There are some edge cases related to particles bouncing back into your volume once they leave (such as scattering off some other object). If you have that issue there are workarounds.
Your processing should probably keep to ntuples. You can use HistoManagers in Geant4 to populate histograms in real time that can be saved as CSV. But that isn’t very flexible and you can always go back to reprocess list mode data.
Thank you so much, once again! I’ve got a version of the code that appears to work as intended when I run one event. However, when I use the “/run/beamOn #” command in the visualizer to generate more than one event my program crashes with a segmentation fault. Do you know why this might be? I’ve attached my updated code below–it’s the only thing that I have changed. Any advice you can give would be greatly appreciated!
G4LogicalVolume* post_volume = aStep->GetPostStepPoint()->GetTouchableHandle()->GetVolume()->GetLogicalVolume();
G4String vol_name = post_volume->GetName();
G4bool boundary = aStep->GetPreStepPoint()->GetStepStatus()==fGeomBoundary;

if ((vol_name == "Detector") && (boundary)){
    //get kinetic energy, momenta, particle name
    G4double KE = aStep->GetPostStepPoint()->GetKineticEnergy();
    G4double p_x = aStep->GetPostStepPoint()->GetMomentum().x();
    G4double p_y = aStep->GetPostStepPoint()->GetMomentum().y();
    G4double p_z = aStep->GetPostStepPoint()->GetMomentum().z();

    G4String particleName = aStep->GetTrack()->GetDynamicParticle()->GetDefinition()->GetParticleName();

    //print out the 4-mom.
    G4cout << "Particle Name, 4-mom.: " << particleName << ", " << "(" << KE << ", " << p_x << ", " << p_y << ", " << p_z << ")" << G4endl;

    //record the 4-mom.
    G4AnalysisManager* analysisManager = G4AnalysisManager::Instance();
    analysisManager->FillNtupleSColumn(0, 0, particleName);
    analysisManager->FillNtupleDColumn(0, 1, KE);
    analysisManager->FillNtupleDColumn(0, 2, p_x);
    analysisManager->FillNtupleDColumn(0, 3, p_y);
    analysisManager->FillNtupleDColumn(0, 4, p_z);
    analysisManager->AddNtupleRow(0);
 }

 return 0;
Nothing looks obvious in the code you provided. Could you post the whole file? Right now all I see is that your original ProcessHits return was designated as a boolean (usually you just return true at the end) but returned nothing and this new version now returns False.
Here’s all of the code. I’m happy to send any other related files as well, if they’d be useful!
I only put the return False at the end in order to get rid of a compiler warning message (warning: non-void function does not return a value [-Wreturn-type])–the segmentation fault occurred before that change too, so I don’t think that’s the issue.
#include "detector.hh"
#include "G4ParticleDefinition.hh"
#include "G4AnalysisManager.hh"

MySensitiveDetector::MySensitiveDetector(G4String name) : G4VSensitiveDetector(name)
{}

MySensitiveDetector::~MySensitiveDetector()
{}

G4bool MySensitiveDetector::ProcessHits(G4Step *aStep, G4TouchableHistory *ROHist)
{
    G4Track *track = aStep->GetTrack();

    G4LogicalVolume* post_volume = aStep->GetPostStepPoint()->GetTouchableHandle()->GetVolume()->GetLogicalVolume();
    G4String vol_name = post_volume->GetName();
    G4bool boundary = aStep->GetPreStepPoint()->GetStepStatus()==fGeomBoundary;

    if ((vol_name == "Detector") && (boundary)){
        //get kinetic energy, momenta, particle name
        G4double KE = aStep->GetPostStepPoint()->GetKineticEnergy();
        G4double p_x = aStep->GetPostStepPoint()->GetMomentum().x();
        G4double p_y = aStep->GetPostStepPoint()->GetMomentum().y();
        G4double p_z = aStep->GetPostStepPoint()->GetMomentum().z();

        G4String particleName = aStep->GetTrack()->GetDynamicParticle()->GetDefinition()->GetParticleName();

        //print out the 4-mom.
        G4cout << "Particle Name, 4-mom.: " << particleName << ", " << "(" << KE << ", " << p_x << ", " << p_y << ", " << p_z << ")" << G4endl;

        //record the 4-mom.
        G4AnalysisManager* analysisManager = G4AnalysisManager::Instance();
        analysisManager->FillNtupleSColumn(0, 0, particleName);
        analysisManager->FillNtupleDColumn(0, 1, KE);
        analysisManager->FillNtupleDColumn(0, 2, p_x);
        analysisManager->FillNtupleDColumn(0, 3, p_y);
        analysisManager->FillNtupleDColumn(0, 4, p_z);
        analysisManager->AddNtupleRow(0);
     }

     return 0;

}
This looks fine, although I think the default behavior is generally expected to be to return True. The only logical difference now is that there is a possibility that you dont update the ntuple. Is there any other part of the code that assumes that the ntuple is being updated with each event? Such as a counter or indexing?
The only other part of the code that is related to the ntuple is when I write the data into the .csv file in my run action file. Here’s the code–could this be related at all?
#include "run.hh"

MyRunAction::MyRunAction()
{}

MyRunAction::~MyRunAction()
{}

void MyRunAction::BeginOfRunAction(const G4Run*)
{
    G4AnalysisManager* analysisManager = G4AnalysisManager::Instance();

    analysisManager->OpenFile("output.csv");
    analysisManager->CreateNtuple("step", "step");
    analysisManager->CreateNtupleSColumn("Particle Name");
    analysisManager->CreateNtupleDColumn("Particle Energy");
    analysisManager->CreateNtupleDColumn("Particle p_x");
    analysisManager->CreateNtupleDColumn("Particle p_y");
    analysisManager->CreateNtupleDColumn("Particle p_z");
    analysisManager->FinishNtuple();


}

void MyRunAction::EndOfRunAction(const G4Run*)
{
    G4AnalysisManager* analysisManager = G4AnalysisManager::Instance();

    analysisManager->Write();
    analysisManager->CloseFile();
}
I figured out what was causing the segfault–the code I had above didn’t check for the track leaving the world volume which caused the physical volume to be a null pointer. I made sure to check for this before doing my analysis and everything works fine now. Here’s the final code, in case anyone finds it useful:
G4bool worldboundary = aStep->GetPostStepPoint()->GetStepStatus()==fWorldBoundary;
    if (!worldboundary){

        G4LogicalVolume* post_volume = aStep->GetPostStepPoint()->GetTouchableHandle()->GetVolume()->GetLogicalVolume();
        G4String vol_name = post_volume->GetName();
        G4bool boundary = aStep->GetPreStepPoint()->GetStepStatus()==fGeomBoundary;

        if ((vol_name == "Detector") && (boundary)){
            //get kinetic energy, momenta, particle name
            G4double KE = aStep->GetPostStepPoint()->GetKineticEnergy();
            G4double p_x = aStep->GetPostStepPoint()->GetMomentum().x();
            G4double p_y = aStep->GetPostStepPoint()->GetMomentum().y();
            G4double p_z = aStep->GetPostStepPoint()->GetMomentum().z();

            G4String particleName = aStep->GetTrack()->GetDynamicParticle()->GetDefinition()->GetParticleName();

            //print out the 4-mom.
            G4cout << "Particle Name, 4-mom.: " << particleName << ", " << "(" << KE << ", " << p_x << ", " << p_y << ", " << p_z << ")" << G4endl;

            //record the 4-mom.
            G4AnalysisManager* analysisManager = G4AnalysisManager::Instance();
            analysisManager->FillNtupleSColumn(0, 0, particleName);
            analysisManager->FillNtupleDColumn(0, 1, KE);
            analysisManager->FillNtupleDColumn(0, 2, p_x);
            analysisManager->FillNtupleDColumn(0, 3, p_y);
            analysisManager->FillNtupleDColumn(0, 4, p_z);
            analysisManager->AddNtupleRow(0);
        }
    }
After doing analysis on output generated using the code above, the e- and e+ generated are still significantly lower energy than I’d expect using Pythia and they still display a similar spectrum to before with two peaks instead of one–I’ve attached a similar plot to before below. I’m still having trouble understanding why this discrepancy occurs, and what I should do to fix it. Is there anything else that could cause this behavior that I’m not accounting for?