Hi all,
I’m using Geant4 11.1 and Root 6.28 to simulate output from an HPGe detector.
-
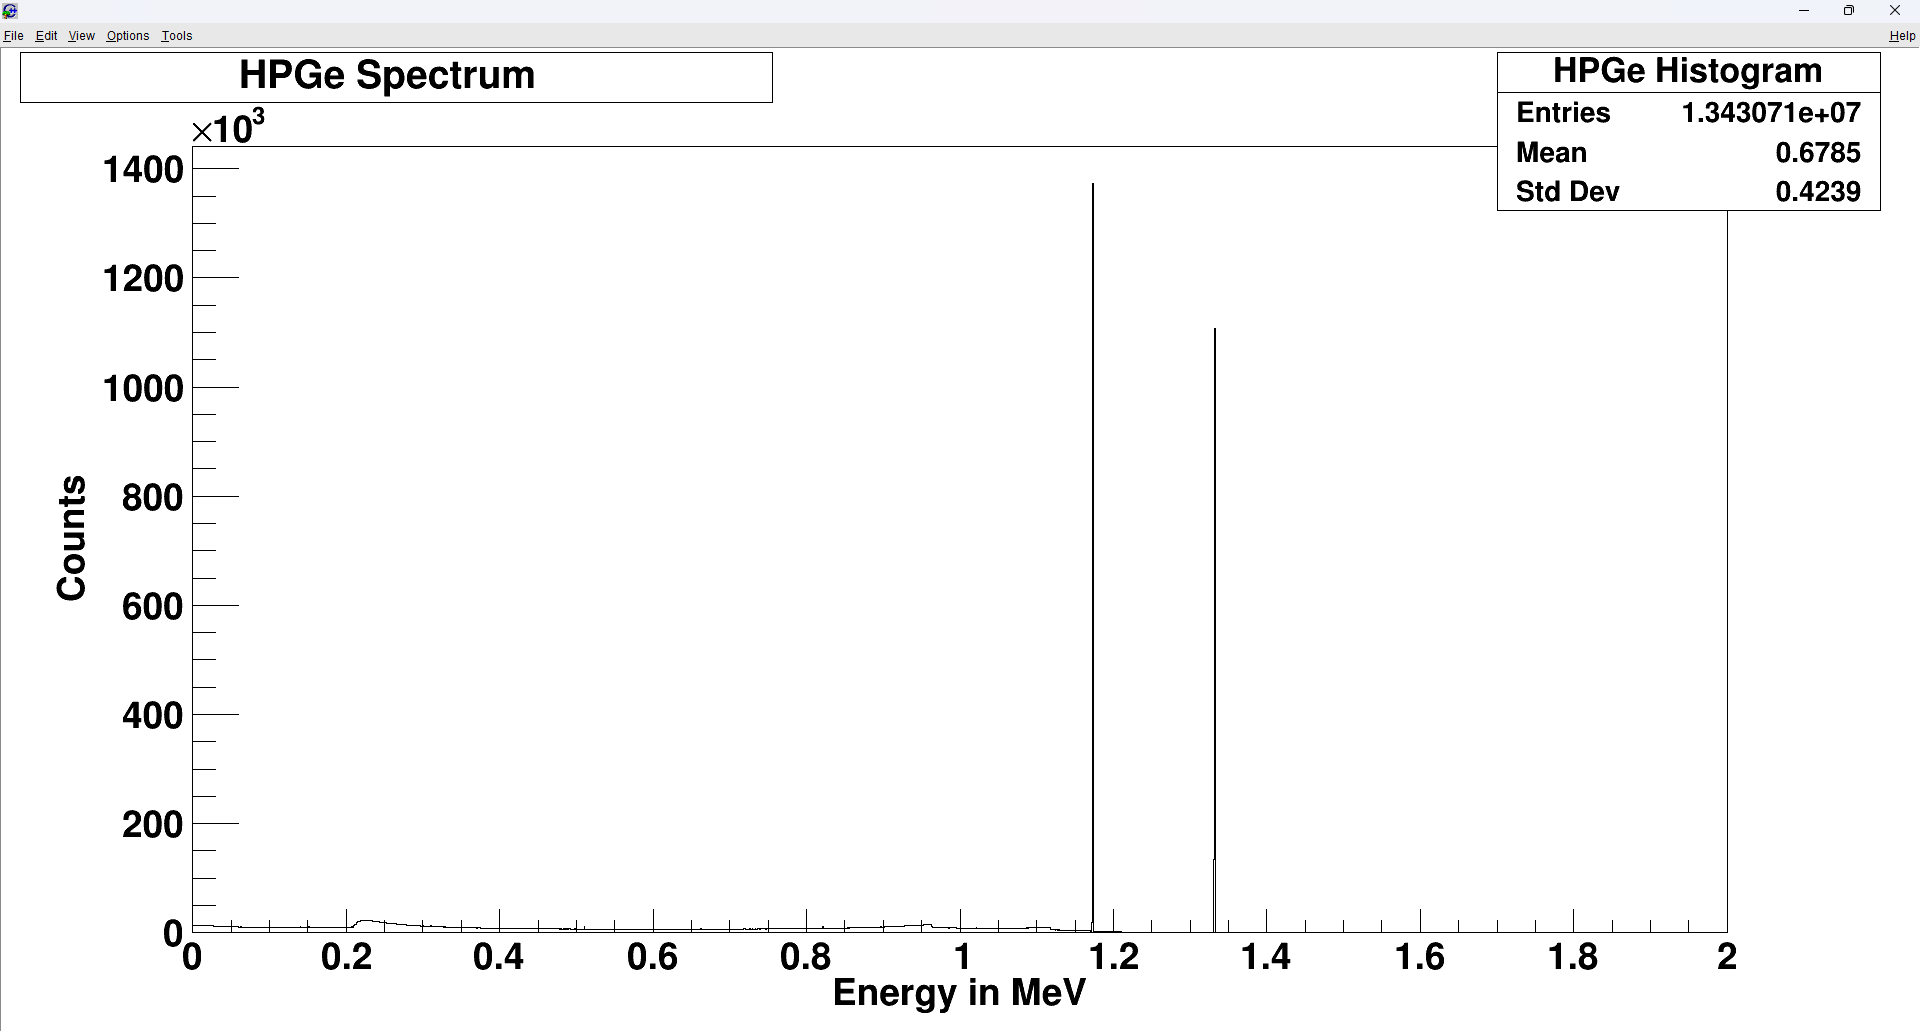
I had a Geant4 output in Root format as shown in below
-
I want to have 2 peaks like experiment. So, I wrote a Root script to implement it
Double_t fun_FWHM(Double_t* energy, Double_t* par)
{
	Double_t e = energy[0];
    return (par[0] + par[1]*TMath::Sqrt(e + par[2]*e*e)); // in keV
}

Double_t fun_gauss(Double_t energy)
{
	Double_t ene_tmp = energy*1000.0; // convert to keV
	Double_t a, b, c;
	a = 1.56762; // for keV
	b = 0.0154; // for keV
	c = 0.000337181; // for keV

	Double_t par[3];
	par[0] = a;
	par[1] = b;
	par[2] = c;

	return 0.001*(ene_tmp + fun_FWHM(&ene_tmp, par)*gRandom->Gaus()/2.355); // in MeV
}

void plotReso()
{
	gROOT->Reset();
	gROOT->SetStyle("Plain");

	// read root file
	TFile* f = new TFile("defaultFilename.root", "READ");
	f->ls(); // list all Tree and Historgram

	double eDep; // in MeV

	// create a new tree
	TTree* tree = (TTree*)f->Get("HPGe;1");
	tree->Print(); // print all branches
	tree->SetBranchAddress("fEdep", &eDep); // set branch "fEdep" as a object to read
	int entries = tree->GetEntries(); // get entries
	cout << "Number of entries: " << entries << endl;

	// create a new fited histogram
	TH1D* eDepHist = new TH1D("HPGe Histogram", "Deposition Energies", 2000, 0., 2);

	// read ntuples from the root file to above histogram
	for(int i=0; i<entries; ++i)
    {
        tree->GetEntry(i);

        //cout << eSum << endl;
        eDepHist->Fill(fun_gauss(eDep));
	//eDepHist->Fill(eDep);
    }

	// create a canvas to plot graph
	TCanvas* c1 = new TCanvas("c1", " ", 20, 20, 800, 1000);
	// gPad->SetLogy(1);
	eDepHist->SetTitle("HPGe Spectrum ");
	eDepHist->GetXaxis()->CenterTitle(true);
	eDepHist->GetYaxis()->CenterTitle(true);
	eDepHist->GetXaxis()->SetTitle("Energy in MeV");
	eDepHist->GetYaxis()->SetTitle("Counts");
	eDepHist->Draw();
}
The plot doesn’t differ from the above plot.
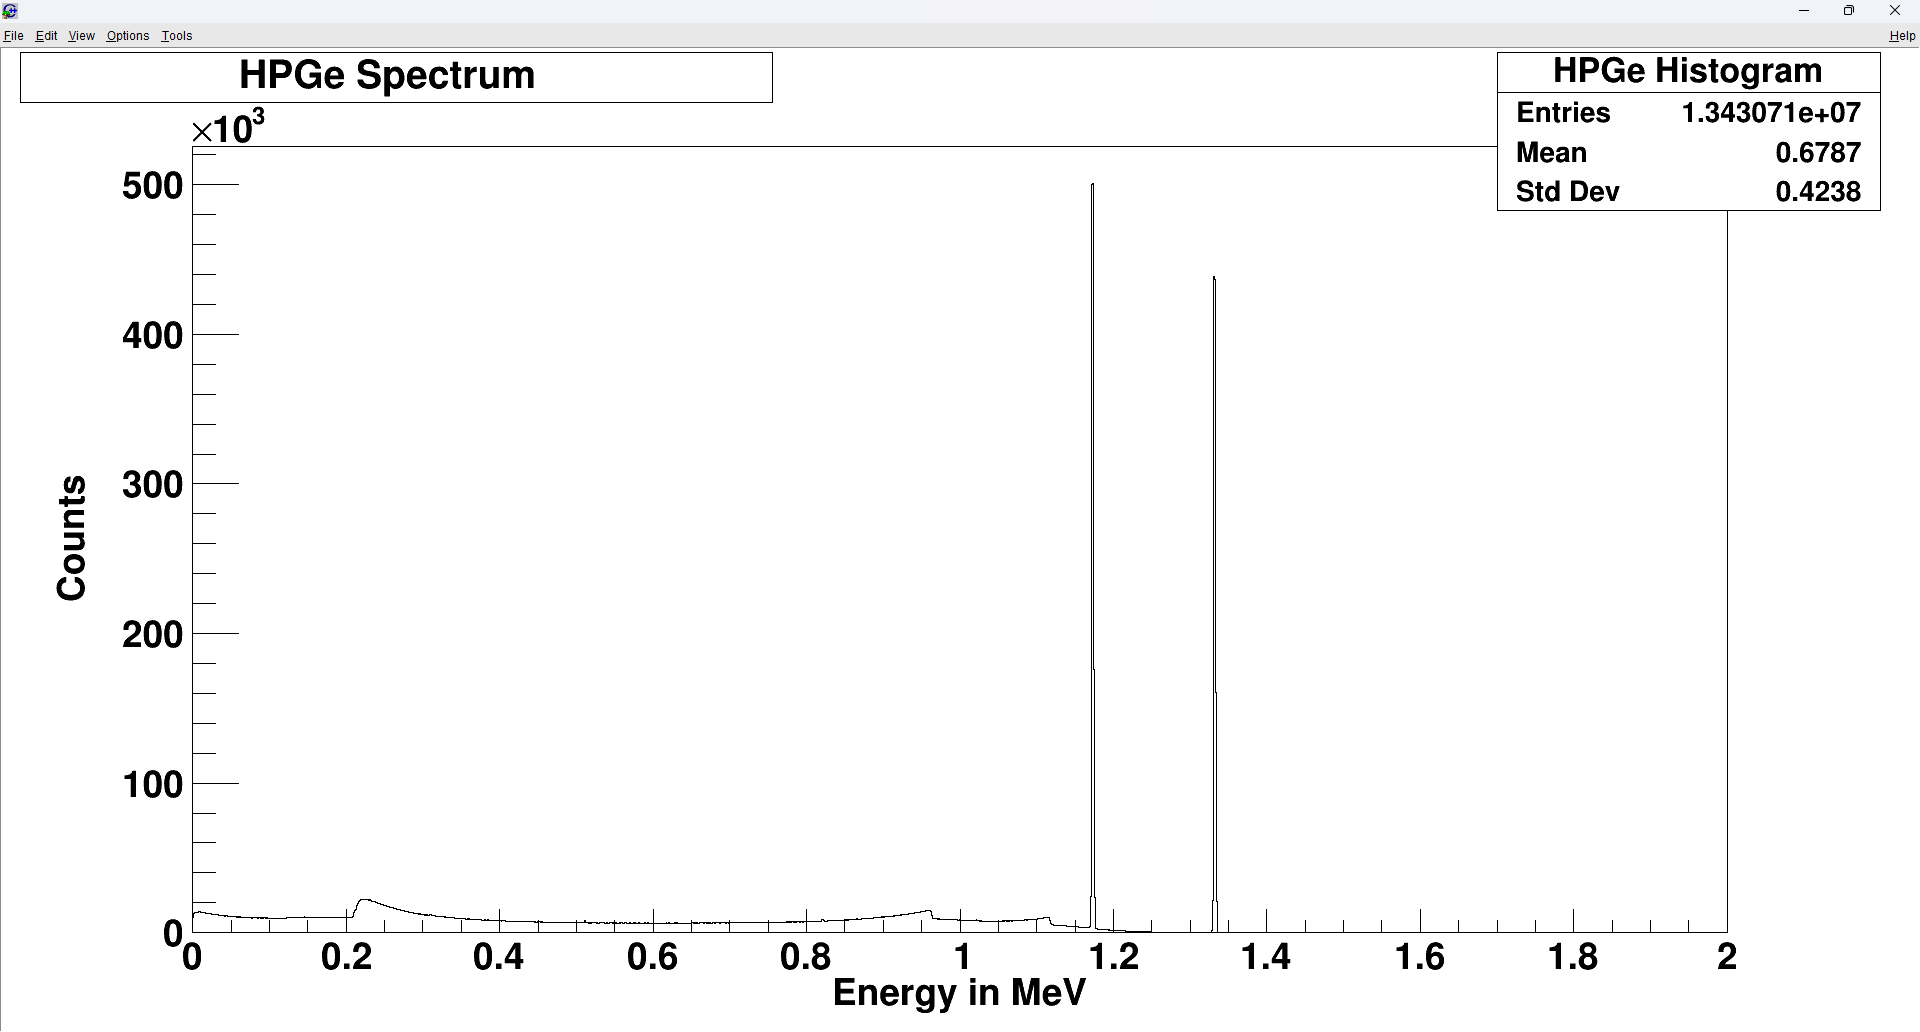
Can anyone help me to correct the root file? Thank you in advance.