Hi all,
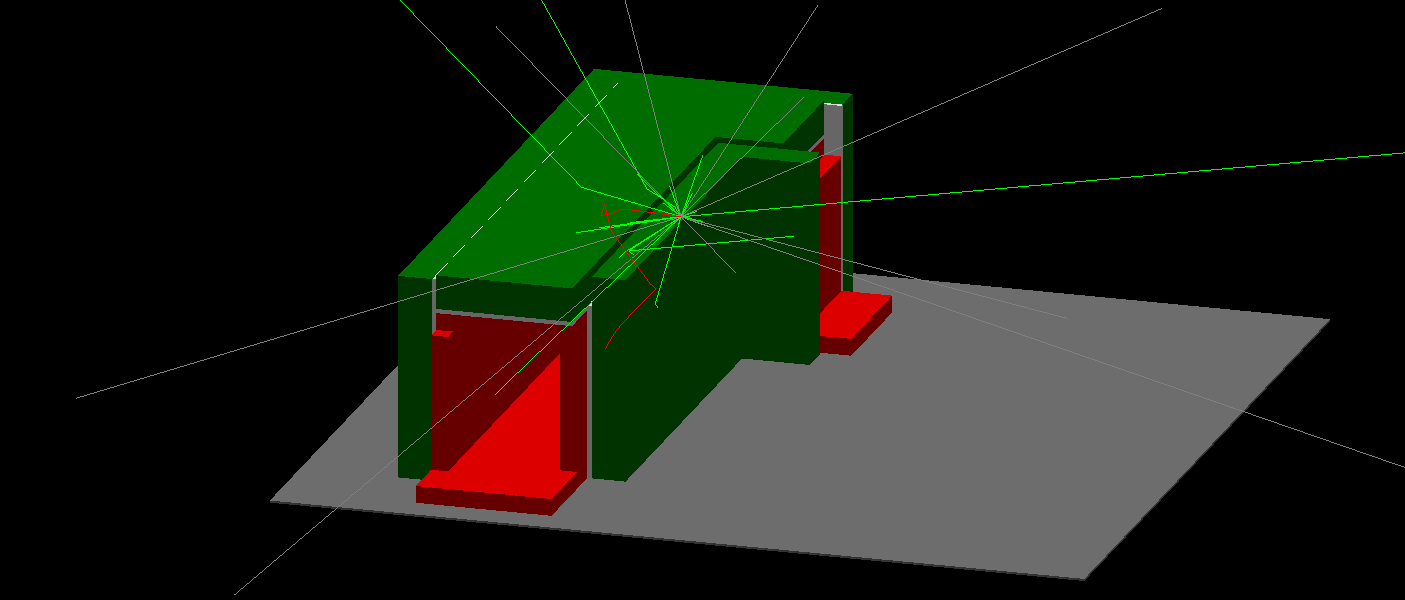
I’m a newby, working with a student to simulate a 60Co source surrounded by lead. We’re basing our work on the example rdecay02. My question is, what are the grey tracks I’m observing in the visualizer (Qt)? The image is below. The relevant portion of the vis.mac is below that. In the image, red blocks are lead, grey panels are aluminum, and dark green is polyethylene. Ten primary events were simulated.
My understanding is the track colors are green = photons (I see two per primary event) and red = electron (I see one produced in this run, squigling in the middle of the lead tunnel). But what are the grey lines?? I see 1 grey track per primary. Are these primary electrons (there should be one per primary)? If so, why are these tracks grey. If they are primary electrons, then there’s a mistake in my code, since they should be stopped by the lead.
Thanks for your help.
Here are the important potions of the vis.mac file.
/vis/scene/add/trajectories smooth
/vis/modeling/trajectories/create/drawByCharge
/vis/modeling/trajectories/drawByCharge-0/default/setDrawStepPts false
/vis/modeling/trajectories/drawByCharge-0/default/setStepPtsSize 1

/vis/modeling/trajectories/create/drawByParticleID
/vis/modeling/trajectories/drawByParticleID-0/set e- red
/vis/modeling/trajectories/drawByParticleID-0/set gamma green
/vis/modeling/trajectories/drawByParticleID-0/set neutron yellow
/vis/modeling/trajectories/drawByParticleID-0/set alpha blue
/vis/modeling/trajectories/drawByParticleID-0/set GenericIon blue
#
# To superimpose all of the events from a given run:
/vis/scene/endOfEventAction accumulate
Geant4 Version: 11.2.2
Operating System: Windows 11
Compiler/Version: VS 17.10.2
CMake Version: 3.30.0