Hello!
I am relatively new to Geant4. I have simulated a scintillation detector and want to record the arrival times of optical photons arriving at the photocathode of a photomultiplier tube. So I want to end up with a plot of amplitude against time. Can anyone give me some guidance on how I would do this? I have assigned the photodetector as a sensitive detector to record ‘hits’ - Do I use GlobalTime() to get time of arrival? And how can I get a histogram of amplitude against time for this?
User defined stepping action. In your stepping action you can put a condition (if volume == myvolume & if particle == myparticle) and save the global time
Via hits you can define a sensitive detector and save the global time when the desired particle is registered in the hit
Focusing on your problem, with these two methods you are going to get only the time of arrival of each photon on the pmt. To get an amplitude you have to either simulate the signal in Geant or via an external software.
Mind that in some case just knowing the number of photons on the cathode might be enough. You can also consider a certain pde when registering the photons number in the stepping action.
Unfortunatly Geant does not include the signal generation from your detector. That is something that you have to develop by yourself. You can either write a C++ function/library that does it and include it in the stepping action/event action or you can extract and save the arriving time of each photon and simulate the detector response after the geant simulation.
As I said before this is the final step of the simulation. I think that you can do a lot just with the information of the number of photons detected by the pmt (maybe including pde and time). Then if everything is working you can start to implement the signal digitization step but before doing so I would check that everityng is working fine using just the simple information I mentioned before.
Sure - how can I help? In order to get the time of arrival you need to implement GetGlobalTime(). This can be done in your SteppingAction class, depending on how you have set up your simulation. I would suggest you look at the GEANT4 optical examples, especially LXe example. It won’t give you exactly what you want but I found it a good place to start.
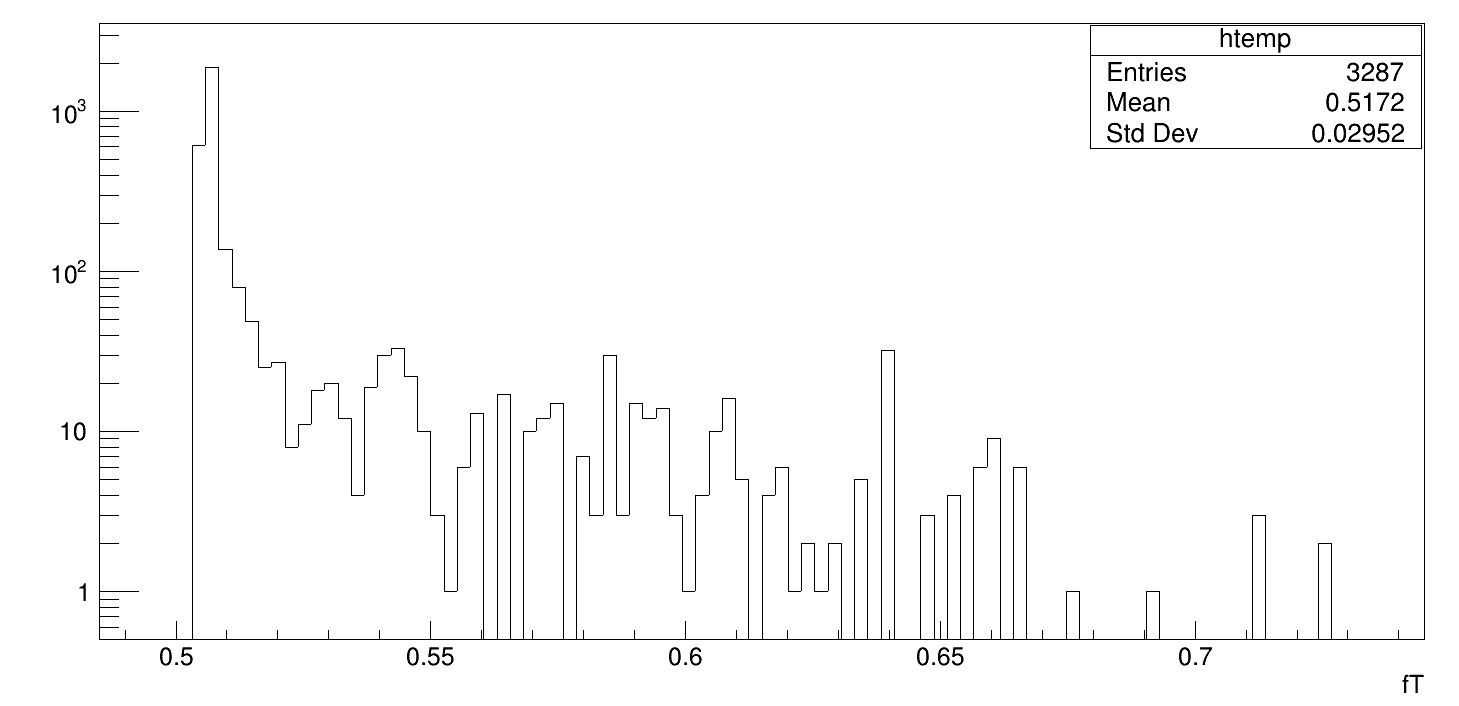
@EscapingEntropy I am getting the time histogram. I want to find out mean arrival time of the optical photon but my distribution not coming Gaussian. Can you comment on this? I have attached Bialcali Photocathode as my scorer which is coupled with the scintillator crystal.
I think the figure is a pulse and its mean time can be computed. If a number of such pulses, you will get many values of means, the distribution of these means may be what you require.
The figure is a histogram of the global time of optical photons incident on the photocathode. Global time will include transit time from source gamma ray to the scintillator, emission time of the scintillator (a single exponential as you have defined it in your code) and transit time to the photocathode. Depending on your geometry, the shape could be exponential convolved with a Gaussian. If the emission time dominates, it would be an exponential. I do not know the time scale of your figure, so I cannot tell if the decay constant is ~19ns (which I would expect).
To find the mean arrival time, you could fit the figure to a simple single exponential A*exp(-t/tau). tau is the mean arrival time. I would suggest that you re-run the simulation first to get more statistics.
Note that the histogram is NOT the pulse shape you would get in a practical experiment. It has to be convolved with the response time of the photocathode, the photomultiplier and the shaping circuitry. That is outside the scope of this discussion.
Assuming your histogram corresponds to the arrival time of the optical photons of one event, fitting the data to A*exp(-t/tau) will give you one estimate of the mean arrival time, e.g. tau_k. Running N events will give you N estimates of the mean arrival time {tau_1, tau_2, … tau_k, …tau_N}. Those will likely be Gaussian distributed. Fitting them to a Gaussian function to get mean tau.
@John_McFee I have used G4double time = preStepPoint->GetGlobalTime() and mpt->AddConstProperty(“FASTTIMECONSTANT”, 19.*ns);. So the time scale of my histogram would be in nanosecond , right? As you said I fitted the exponential decaying histogram. And got ~19 ns,which is the decay constant. So this is not the mean arrival time .
This is very likely true, but not because you defne the FASTTIMECONSTANT to be 19 ns. The “default” unit for time is ns, see System of units — Book For Application Developers 11.2 documentation
So unless you specify something else, numbers that represent time/durations are understood to be given in nano seconds. This also holds for the bins of a histogram…
@weller can you tell me how can I get the TR using above method? @John_McFee Another problem is that although I defined mpt->AddConstProperty(“SCINTILLATIONYIELD”,60./keV); I am getting 20 entries in my histogram in 1 event for 1 MeV.
I can only speculate, but I would naively understand
in such a way that one averages the recorded arrival times (entries in the first histogram, for each event individually) to a single number, and then fill this number into a second histogram. So I would try not fitting the decay constant of the distribution, but taking the mean. In this case, It would not be a problem that there are only 20 recorded arrival times per event, at least from a numerical/fitting perspective. If that number is physically plausible is a different story that depends also on geometry, materials, …
As anticipated in this thread already, the distribution of these averaged arrival times per event could be gaussian as in the second figure from your post.
hm. I would study the examples and look for ones that use a hits map, and then proceed to implement something that evaluates all time recordings in that hit map for the event at hand with the help of the end of event method. the processed number would be filled into a 1d histogram.
Assuming that your histogram (the one with “Entries 14522”) is the histogram of arrival times of optical photons over a large number of events, fitting it to an exponetial function will give the mean arrival time (call it ‘tau’). The uncertainty in tau from the fitting routine (call it ‘sigma_tau’) will be an estimate of the time resolution. (Definition of “resolution” can be a little tricky.)