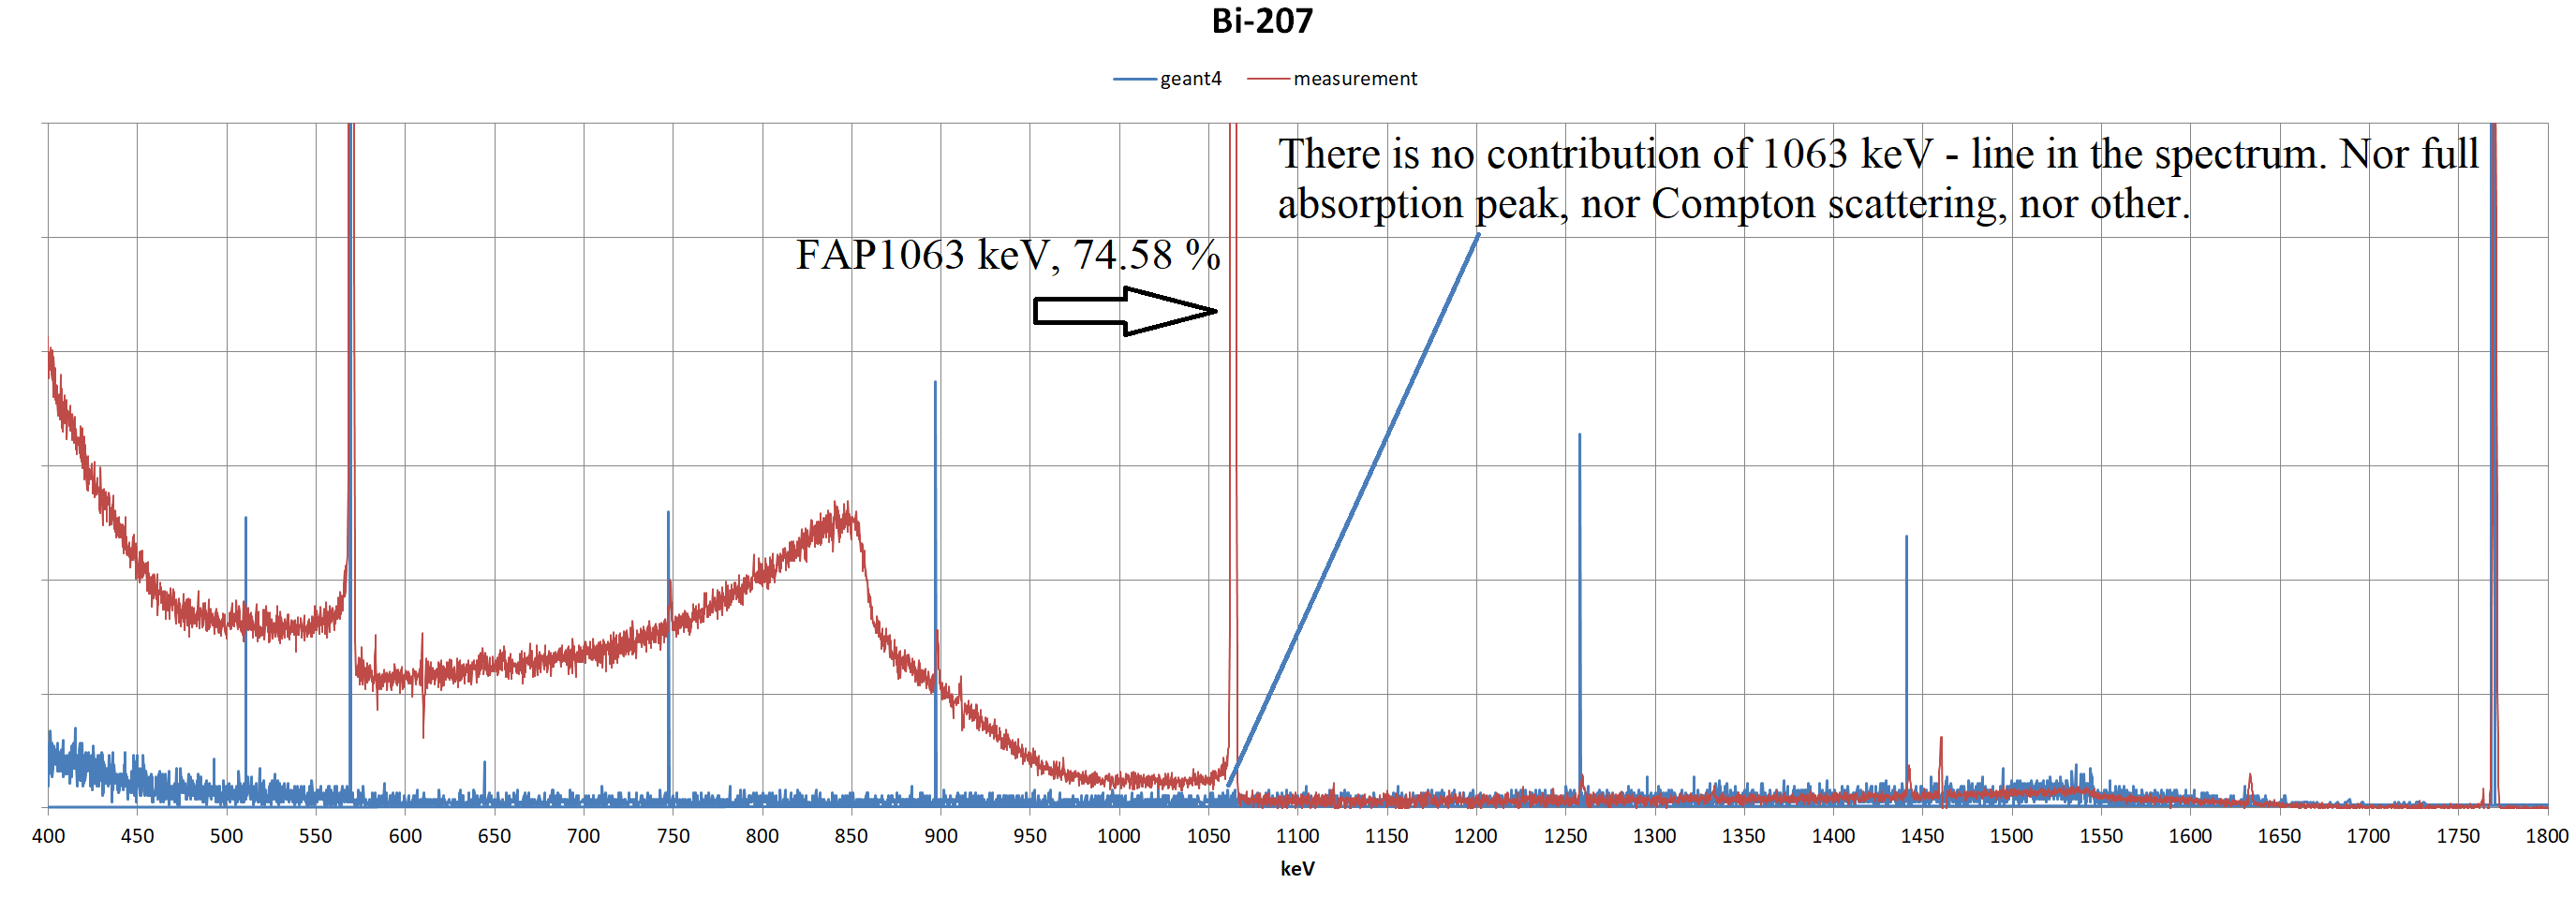
Good day all! I model the response of a HPGe-detector to radionuclide radiation. I have modified example rdecay02 in part of geometry and turn on CorrelatedGamma in BiasedRDPhisics: “deex->SetCorrelatedGamma(true);”, file PhisicsList stay unmodified. I have got a good match with the experimental data for Co-60 and Ba-133. But for the Bi-207 the result is bad. For some reason there is no contribution of 1063 keV - line in the modeled spectrum. There is no full absorption peak, Compton scattering, peaks of single and double escape, peak for 1063 keV + 569 keV = 1633 keV (the most strong and intensive cascade) and etc. Is there some error in modeling from my side or from Geant4 side either? Counting on your help.
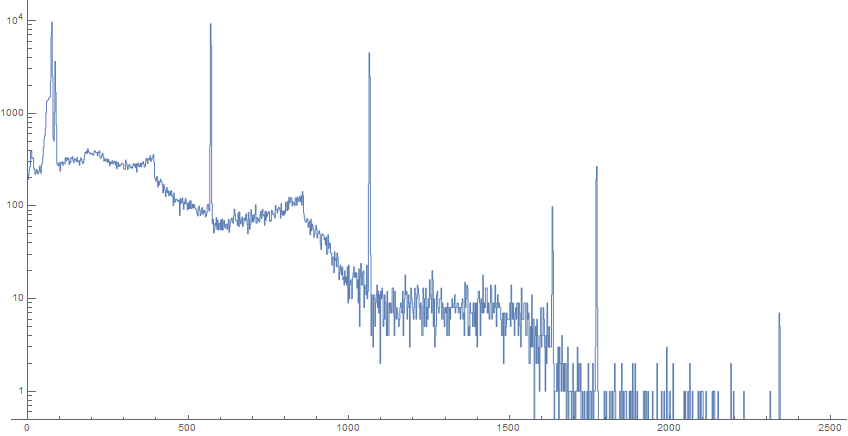
I tried to perform a simulation of Bi207 of an HPGe detector and I can confirm that the Geant4 behavior is right. The obtained spectrum is as expected:
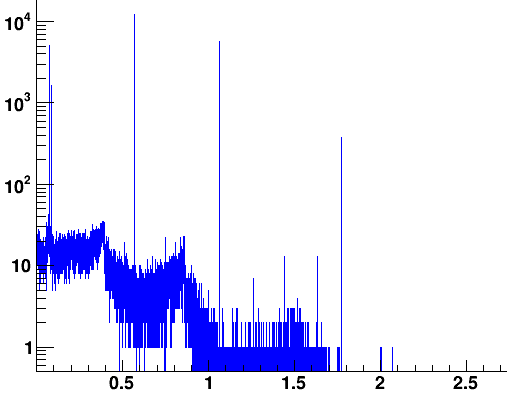
I think you have some problems with your code.
In addition to not having the 1063 keV gamma line, I see in your simulated spectrum (blue) a lot of lines that should not be present.
I suggest you:
Check your setup (maybe you can post an image of your geometry)
Check how the deposited energy is collected.
How did you set the primary particle?
You can use /tracking/verbose 2 in order to check what is happening in your simulation (what particles are generated and tracked)
Thank you for your answer, Andrea.
I use extended example Geant4 “RDecay02”. I checked how the deposited energy collected and I finded the deposited energy are collected within a limited period of time from the beginning of the event. I deleted this part of code.
I’m currently working on a simulation of Bi-207 radioactivity using my own custom detector construction in Geant4. According to the decay data I have, the spectrum should not include gamma emissions; the decay scheme only lists electron capture and beta-plus branches along with associated X-rays (for example, K-shell, L-shell, and Mshell EC emissions).
However, when I plot the energy spectrum from my simulation, I see clear energy peaks that look like they come from gamma rays. I am simply summing all the energy of the radioactive output, yet the spectrum appears to contain gamma energies—even though the input data doesn’t explicitly include gamma lines. I am trying to figure out the cause
By looking at the decay scheme of Bi207, many gammas are emitted, and the simulations obtained with G4.11.3 are consistent with the decay scheme of Bi207.
I’m not sure how you compute the energy spectrum: what energy do you sum? what particles? deposited in materials or kinetic energy of the tracks?
Hi Andrea and Maire,
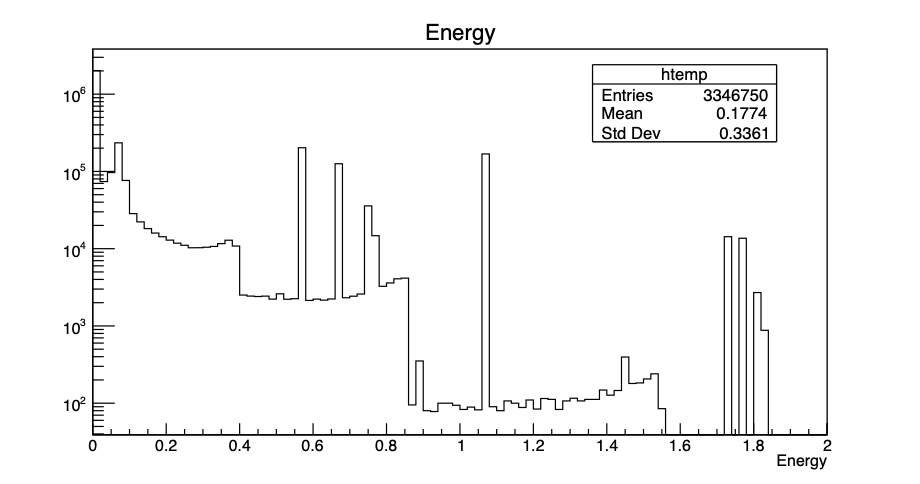
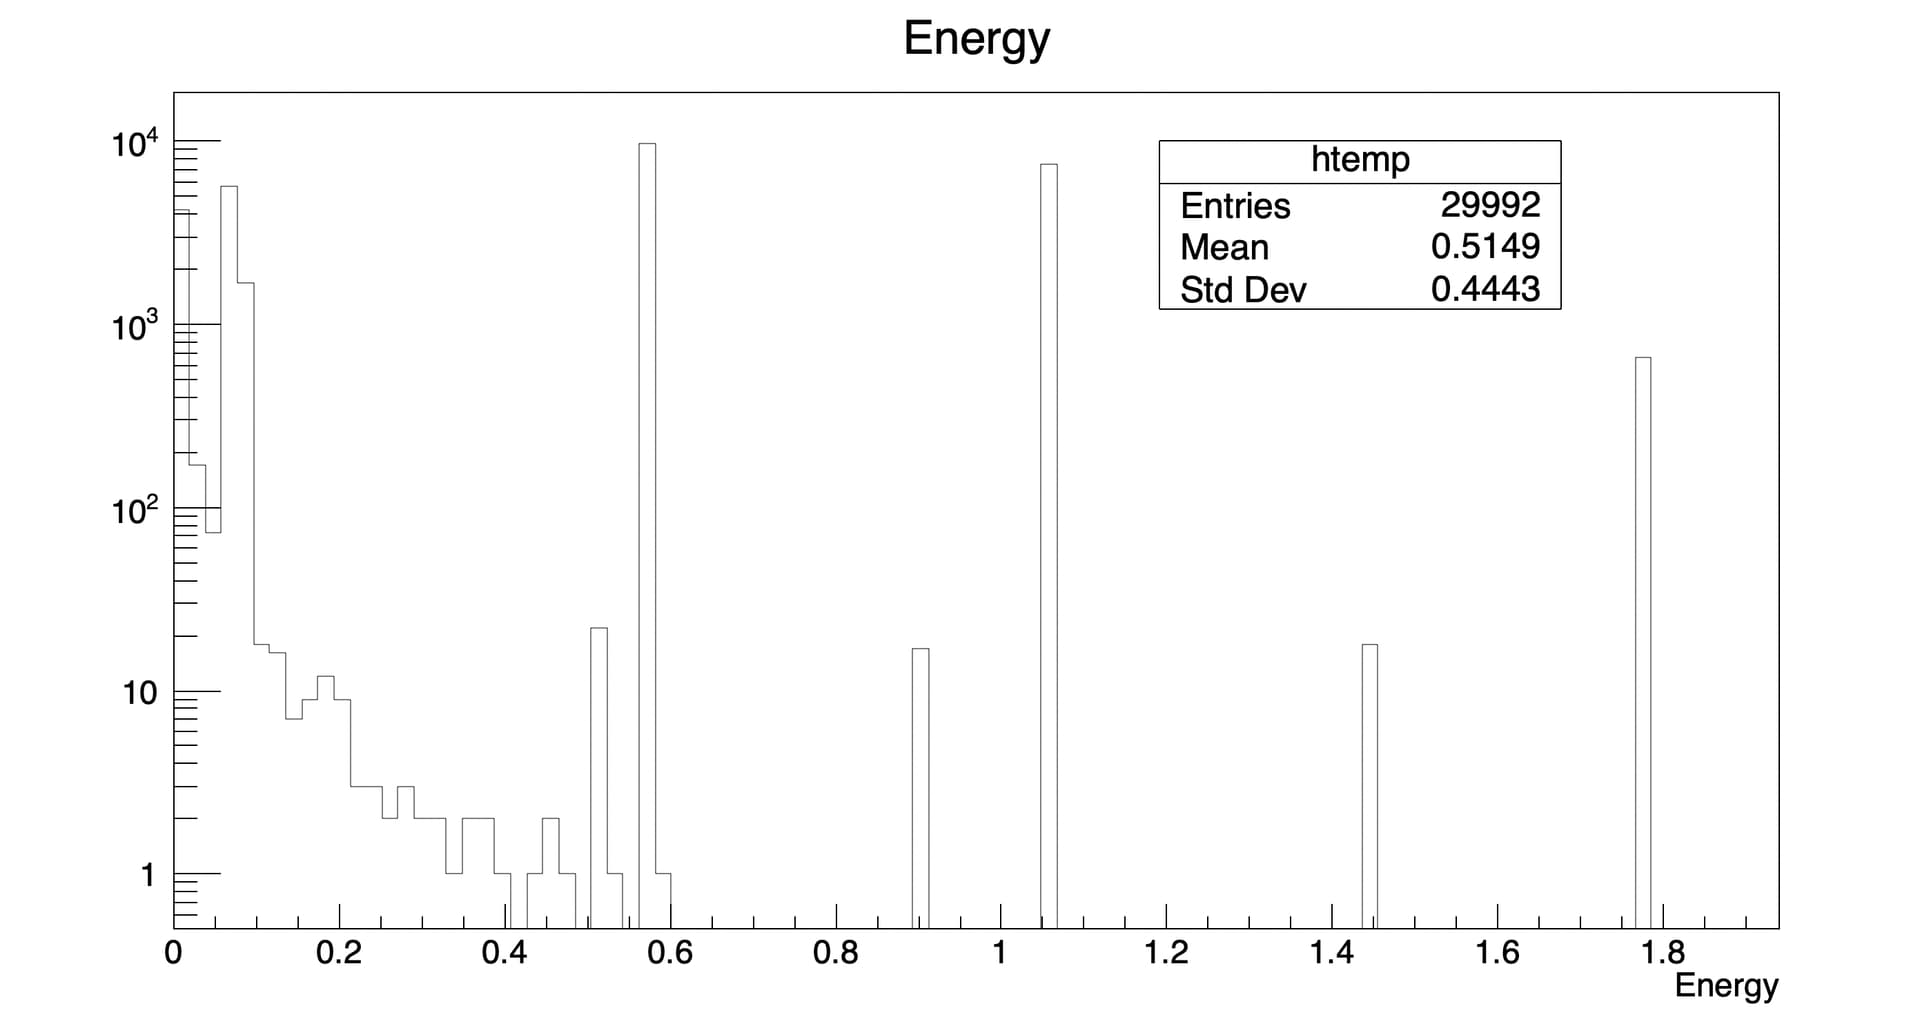
Thank you for your response! In above plot I tried to look at the total energy spectrum of both gamma and e- coming out from Bi-207 and de-excitation of Pb207. I was mistakenly taking the data for all the secondaries produced as well. But, I was able to solve the issue and got the following spectra for just gammas [log scale], this also include a secondaries.