Hello, I apologize if this discussion has already taken place, but I couldn’t find answers to my question.
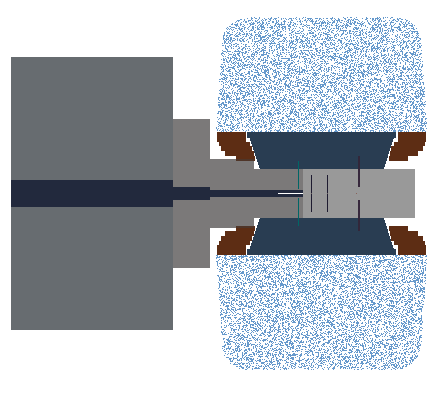
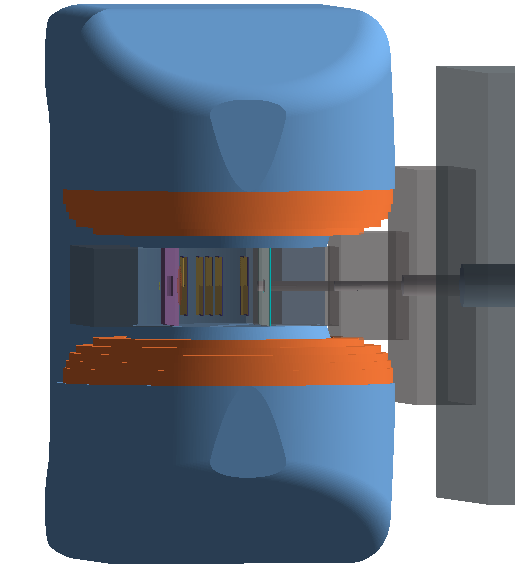
I uploaded the geometry from a .gdml file, assigned materials and display colors to each volume. In 3D, everything appears correctly, but when slicing the geometry, some parts of the magnet are displayed not as solid colors but as colored dots on a white background.
Could you please help me understand why this might have happened and how to fix it?
This looks like it might be a new feature of the visualization: if a volume’s surface is too complicated to render analytically (maybe it’s a multilayer boolean or something), it will be rendered using a “point cloud” (i.e., randomly sampling points on the surface). This is be done per-volume, so you don’t end up with your whole geometry as a point cloud, just because of a single problematic shape.
Mike is right. If the volume is too complex it defaults to cloud drawing. Slicing adds to the complexity - an additional Boolean operation - so it’s tipped your volume into the “too complex” category when you slice.
A very nice image, by the way. It’s good to see users making the most of our visualisation tools.