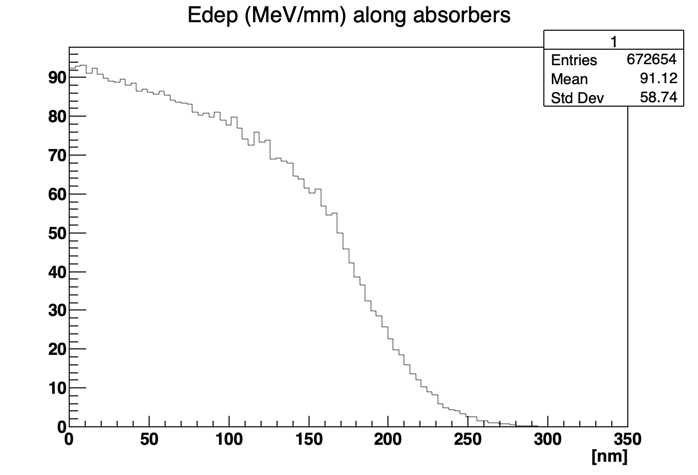
Currently I am running simulations with shooting low energy protons (~15 keV) on a silicon target, while recording the outcome (depth in detector, energy deposit) in different histograms. While playing around with different energies, physics lists and step sizes I made quite a weird observation:
The depth histograms are heavily dependent on the step size. While the step size is above 100 nm the shape of the curve takes a weird double peak structure. Although changing it to 10 nm the curve takes a “gaussian” shape. Lower step sizes result in more narrow peaks until there’s almost just 1 filled bin.
I already looked over my code several times but could not find anything, that could lead to these problems.
Did someone encounter the same problem at one point or does someone have an idea why these things might occur? Or is this even normal?
