Management of G4Allocator's with G4MTRunManager

(I will give a bit of a verbose description and ask simple questions in case this is useful for someone else)

Our Geant4-based application is running out of memory for very long runs. We tracked down the issue to some G4Allocator’s growing linearly with respect to number of events and number of threads, slow but steady.

This graph shows the number of pages as the simulation progresses:

The largest G4Allocator’s are for G4NavigationLevelRep, G4Track, and G4DynamicParticle. The first one I am guessing is due to our voxel geometry.

In order to do this, I had to hack G4AllocatorList to expose the underlying vector of G4Allocator’s and collect sizes at regular intervals.

It looks like our solution will be doing some manual garbage collection, that is clearing up the allocators every now and then. Having the words “memory” and “manually” in the same phrase is certainly scary :smiley: although from the documentation it should be fairly straightforward.

Now my questions, before starting to get my hands dirty (or burnt…):

  • Is there any more documentation beyond this?

  • Is there any special consideration when using G4MTRunManager? I suppose that there is no way to get a handle to the local allocators from the main thread?

  • Are there any guidelines about when it is possible or advisable to reset allocators?

  • Is there a reason for G4AllocatorList not providing a public handle to the list? As far as I can tell, all those allocators can be accessed anyway.

I will report progress below as I dig in.

My first attempt has been resetting the allocators inside the destructor of my Run object, eg:

if (G4Threading::IsWorkerThread()) {
    {
        aTrackAllocator()->ResetStorage();
    }
}

For G4Track, the code above works, and runs are executed in a loop, as expected. I have not checked the results, I am still figuring out if this mitigates the memory problem.

For G4NavigationLevelRep, the same approach as above does not work, because the simulation segfaults when starting a new run.

And for G4DynamicParticle, the allocator is not publicly exposed (pDynamicParticleAllocator() inside particles/management/src/G4DynamicParticle.cc).

Thoughts so far?

Ping @gcosmo and @japost before I start writing a bad pull request and waste more people’s time :slight_smile:

Hi Sergio, I try to answer to your many questions on the subject… and sorry if I could not answer before as I was on leave in the last few days.
The documentation you have found is all what is available at the moment.
Regarding the G4AllocatorList , yes, we can add an accessor to allow browsing the list.
Let me premise that in general and with MT applications in particular, it is important to tune (a) the number of events per run to simulate and (b) the total number of threads to use, based on the resources of the system in use and the complexity of the simulation.
Said that, trying to manipulate the system allocators in order to mitigate memory occupancy can be complex and error prone. In general, as you may have noticed and as we expect, the growth of the allocator pools reaches a plateau after which they become stable and you should be aware that resetting their storage will not return you back the memory to the free store, but rather allow you to reuse the allocated space until you’ll reach again the same occupancy. As you have experienced, there is not a general recipe on how to manipulate the allocator’s storage, as their contents are used in different stages and states of the simulator, and for some of them manipulation may not be at all possible.
Note that you also have the possibility to tune the page size of allocator to faster stabilise its growth, if necessary.
The effect of resetting the storage for some allocators can be irrelevant, for others, like the navigation levels, can be a slight degradation of run-time performance.

1 Like

Hi Sergio, I try to answer to your many questions on the subject… and sorry if I could not answer before as I was on leave in the last few days.

Thank you for your elaborate and kind response :pray: I am sorry if it read as pushy, it was not my intention. I just wanted to make sure to bring your attention to it in case it was missed.

The documentation you have found is all what is available at the moment.

I will try to find time to contribute to that page after I understand things better.

Regarding the G4AllocatorList , yes, we can add an accessor to allow browsing the list.

Great that it can be accessed. I suppose that this applies then to pDynamicParticleAllocator(), ie can its declaration be moved to the header file?

Let me premise that in general and with MT applications in particular, it is important to tune (a) the number of events per run to simulate and (b) the total number of threads to use, based on the resources of the system in use and the complexity of the simulation.

Our current strategy is more about restricting the size of the problem and throwing more money at it and getting more memory :smiley: But yes, you are right. About the number of events, that is not something I had thought of, so that is something to test, thank you.

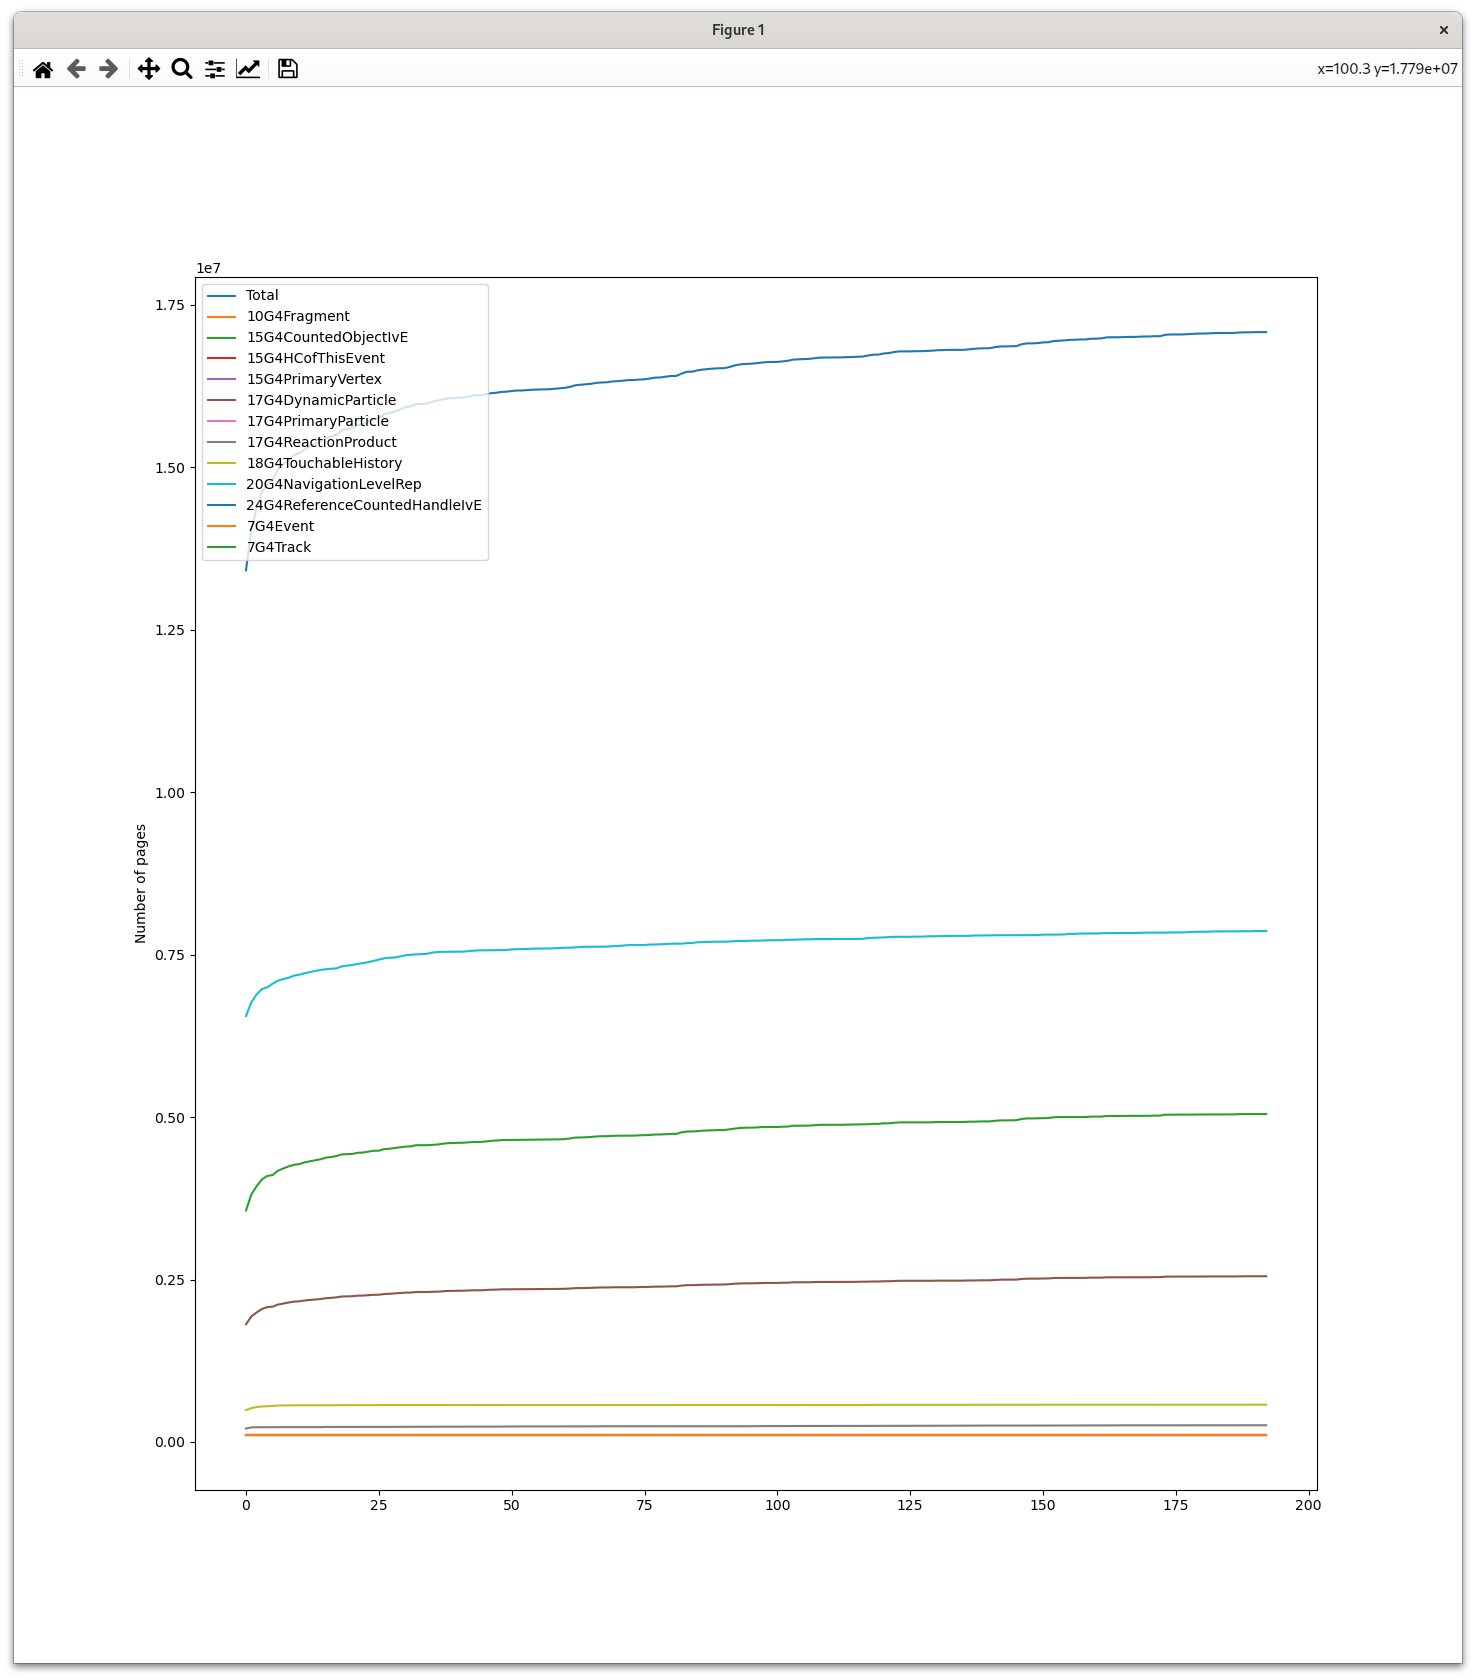
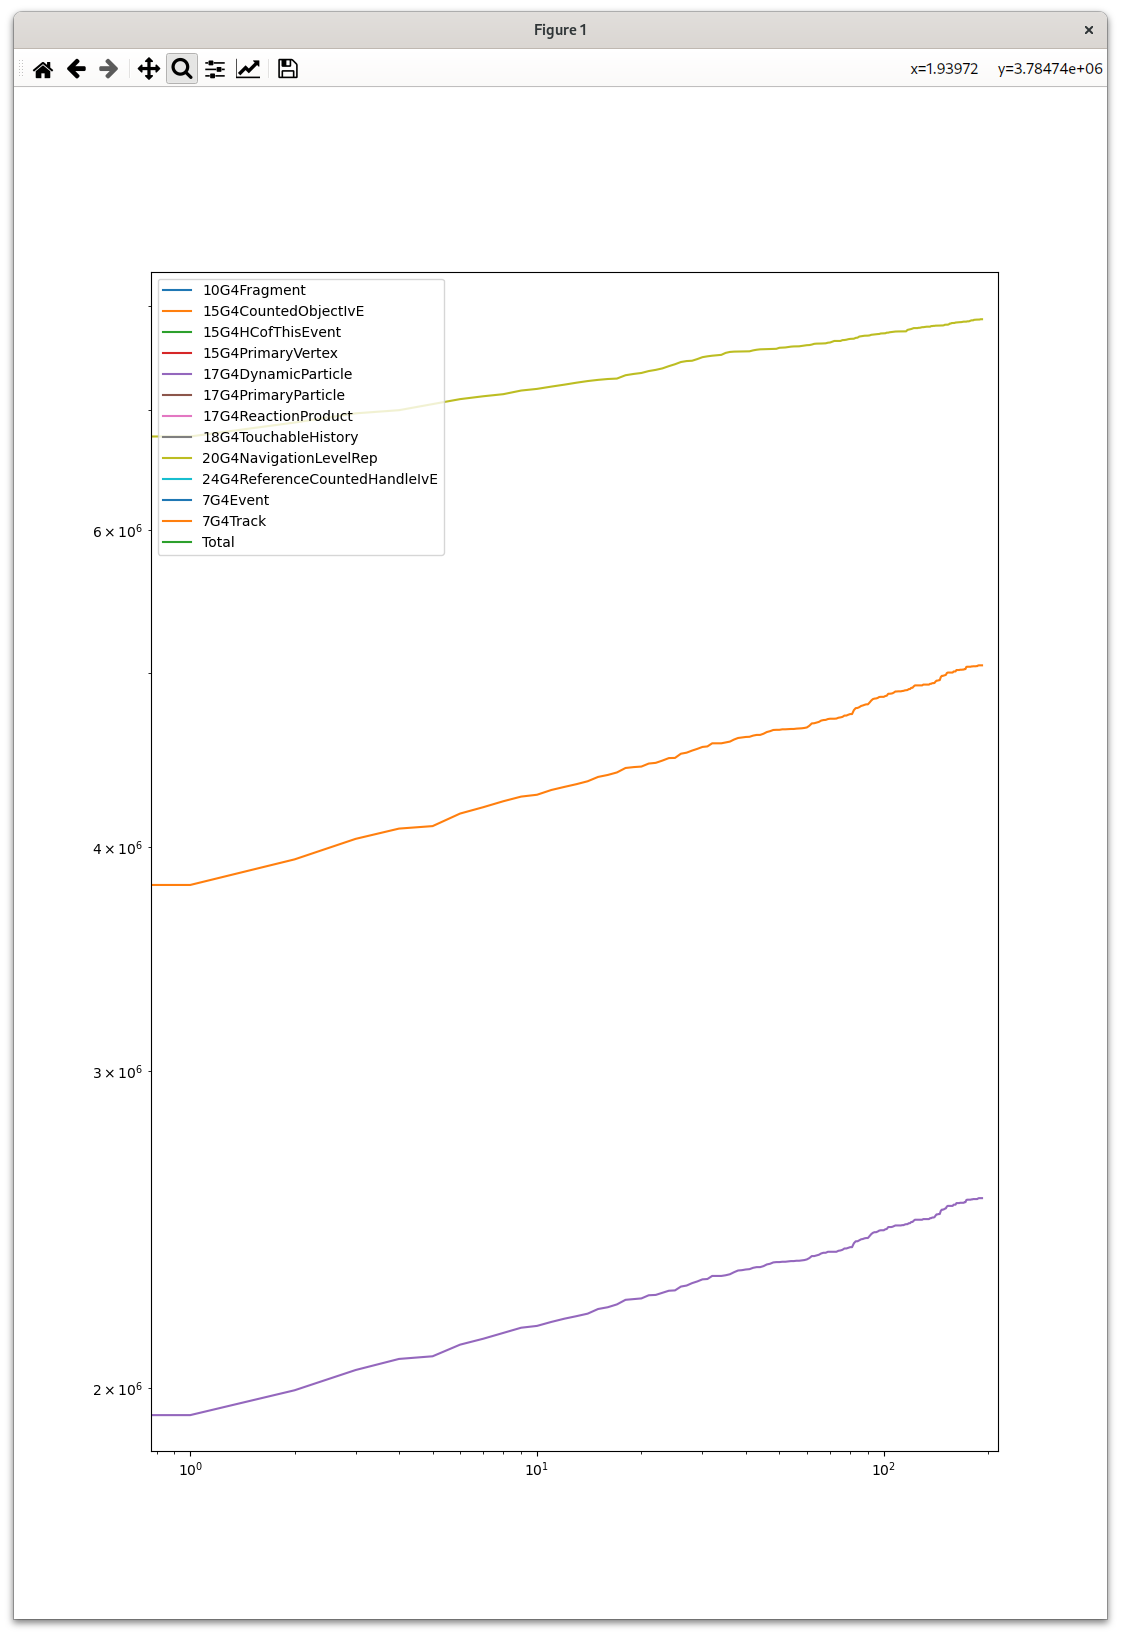
[…] the growth of the allocator pools reaches a plateau after which they become stable

We have not observed that plateau for the largest allocator pools, though, and this is why I was wondering.

[…] you should be aware that resetting their storage will not return you back the memory to the free store, but rather allow you to reuse the allocated space until you’ll reach again the same occupancy.

I think I am not understanding how the pools work :-/

Should the objects be cleaned up manually, then? If they were cleaned up, I would expect the pool size to grow in steps, when there is a new run (or whatever period between clean-up points) where the number of objects requires a larger number of pages than any runs so far. But for those three curves it keeps growing at a quite stable rate.

I am trying to see if I am keeping handles to those objects in my application that would prevent cleanup, but that is not the case. And I would expect much larger memory growth if dynamic particles and tracks were not cleaned up at all… Or maybe not?

As you have experienced, there is not a general recipe on how to manipulate the allocator’s storage, as their contents are used in different stages and states of the simulator, and for some of them manipulation may not be at all possible.

This was my suspicion. I suppose part of the solution will be studying how memory behaves and impose restrictions, plus smoothly restarting the simulation in case of a crash.

Note that you also have the possibility to tune the page size of allocator to faster stabilise its growth, if necessary.

Thanks for the suggestion, we probably want to do that regardless.

The effect of resetting the storage for some allocators can be irrelevant, for others, like the navigation levels, can be a slight degradation of run-time performance.

Thanks! It will anyway have to be tested. I will try to investigate a bit, this would be useful to have in the documentation.

Great that it can be accessed. I suppose that this applies then to pDynamicParticleAllocator(), ie can its declaration be moved to the header file?

Accessing the G4AllocatorList will allow you to go through any of the allocators defined.

We have not observed that plateau for the largest allocator pools, though, and this is why I was wondering.

The screenshot you’re showing now is rather different from the one above… such growth sounds suspicious.

I think I am not understanding how the pools work :-/

Should the objects be cleaned up manually, then? If they were cleaned up, I would expect the pool size to grow in steps, when there is a new run (or whatever period between clean-up points) where the number of objects requires a larger number of pages than any runs so far. But for those three curves it keeps growing at a quite stable rate.

I am trying to see if I am keeping handles to those objects in my application that would prevent cleanup, but that is not the case. And I would expect much larger memory growth if dynamic particles and tracks were not cleaned up at all… Or maybe not?

The allocators are used for objects that frequently get allocated and deleted. Their lifetime (and size) determine the growth of the pool, based on the number of pages that get allocated. If the objects are kept and never deleted, memory grows, no magic!
Big events with many tracks may lead to the pools growing. I don’t know how your application is handling produced events/tracks, but the fact your pools keep growing may indicate that somewhere objects are kept and never deleted from the pool.

This was my suspicion. I suppose part of the solution will be studying how memory behaves and impose restrictions, plus smoothly restarting the simulation in case of a crash.

I think you should understand first if/where information is retained in your application and then tune the production accordingly based on the resources you have (i.e. smaller runs)

Thanks! It will anyway have to be tested. I will try to investigate a bit, this would be useful to have in the documentation.

This can be be very specific to the application though…

Accessing the G4AllocatorList will allow you to go through any of the allocators defined.

That’s true.

The screenshot you’re showing now is rather different from the one above… such growth sounds suspicious.

Actually it is just zooming in on the three largest pools, in logarithmic coordinates.

Big events with many tracks may lead to the pools growing. I don’t know how your application is handling produced events/tracks, but the fact your pools keep growing may indicate that somewhere objects are kept and never deleted from the pool.

Something is keeping the handles for sure, because this is a “memory leak” of sorts. I am scratching my head now, because as far as I know all of the objects in our application are managed, so I would expect a crash when clearing the G4Track pool, which is not the case…

Anyway, thanks a lot for the pointers! I will post again if I find something more conclusive.