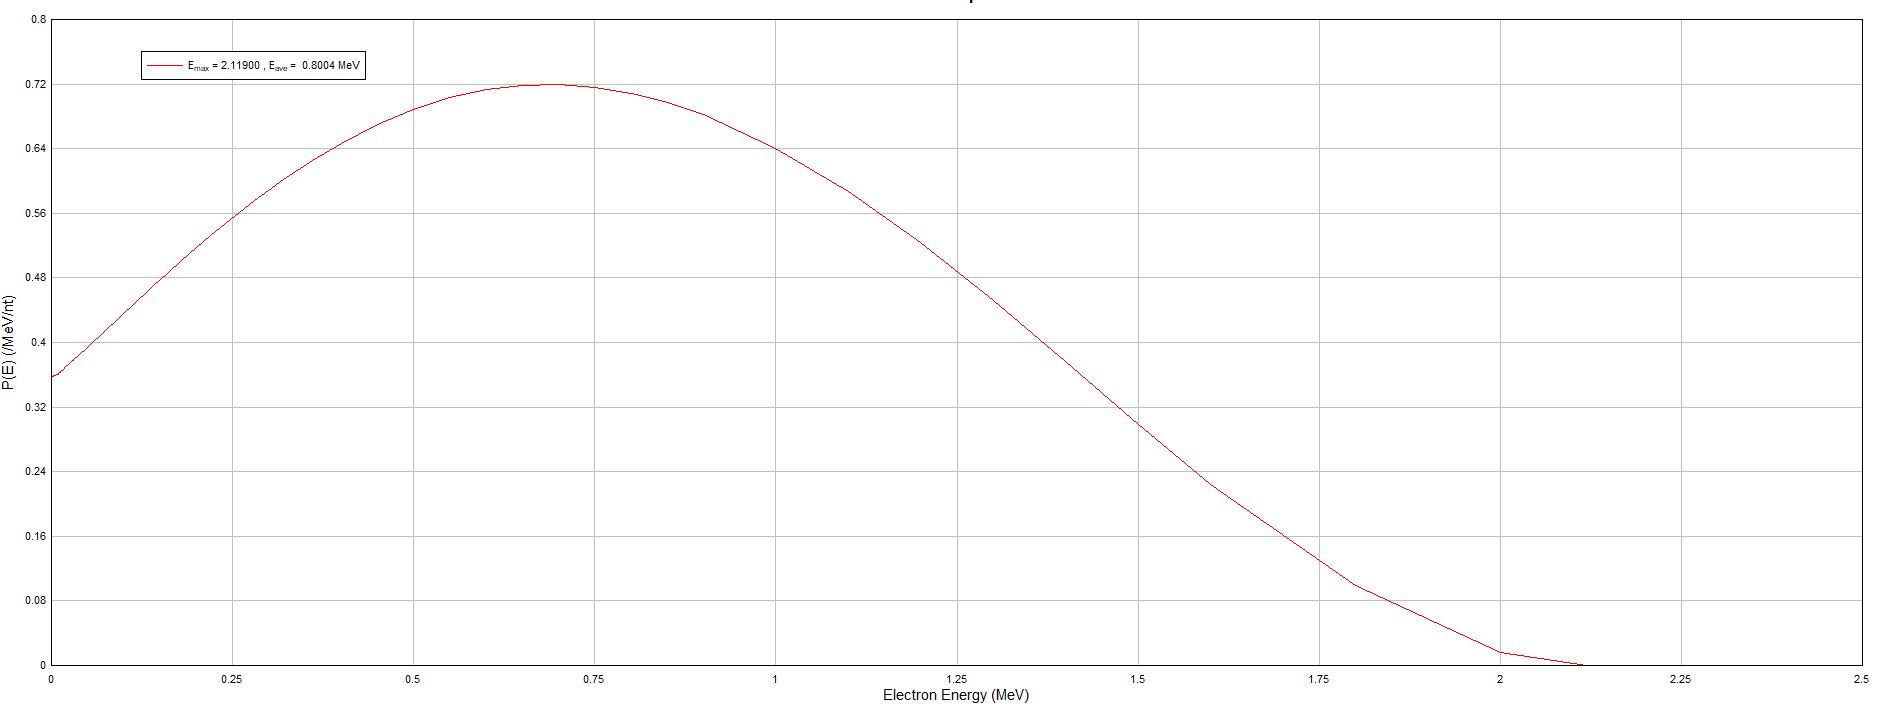
I am trying to simulate the energy spectrum attained in NaI due to I-128 decay. For this, I have modeled a volumetric beta source in NaI Volume. The source has an energy distribution that I attained from ICRP… shown below (source.JPG)
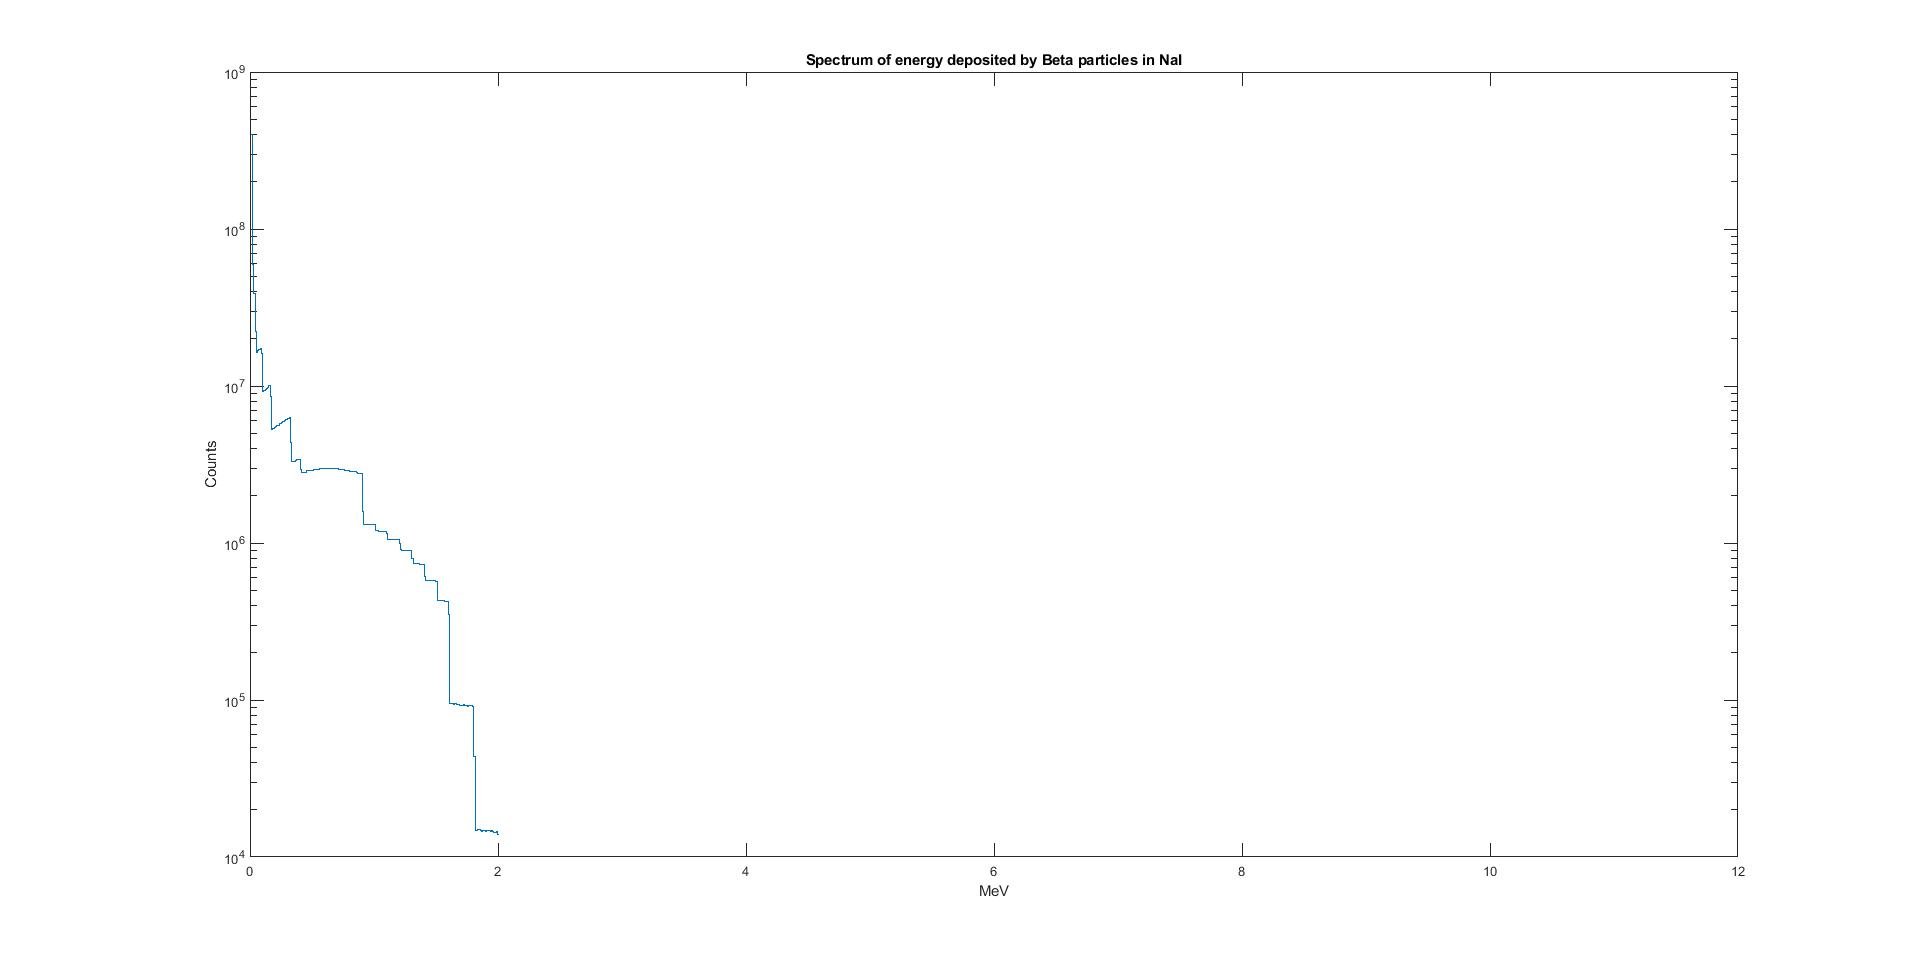
However, after running my simulations, I get a weird looking Beta energy spectrum (betaspectrum.JPG) … shown below. To my understanding and literature, the spectrum has to be smooth. The hard cutoffs at certain energies seem peculiar to me.
As this is the first time I am simulating a source with a user-defined distribution I believe I did some mistake in my macro file, I am attaching my macro file and source file from ICRP below.
Yes I agree that will do a better job.
Which physics list did you use? I am using QGSP_BIC_HP. and I dont see any positrons (e+) in /tracking/verbose 1. I know that the branching ration of e+ is only 6.9 %. I did /run/beamOn 1000 still did not see any positrons. However I do see Te-128? Do I need to add any other physics?
G4Track Information: Particle = Xe128, Track ID = 2, Parent ID = 1
G4Track Information: Particle = I128, Track ID = 1, Parent ID = 0
G4Track Information: Particle = e-, Track ID = 4, Parent ID = 1
G4Track Information: Particle = nu_e, Track ID = 14, Parent ID = 1
G4Track Information: Particle = Te128, Track ID = 13, Parent ID = 1
G4Track Information: Particle = gamma, Track ID = 12, Parent ID = 1
Source macro:
/gps/particle ion
/gps/ion 53 128
/gps/energy 0. eV
/gps/pos/type Volume
/gps/pos/shape Cylinder
/gps/pos/centre -0.450 0.5334 -0.161 m
/gps/pos/rot1 0 1 0
/gps/pos/rot2 0 0 90
/gps/pos/radius 0.0381 m
/gps/pos/halfz 0.0375 m
/gps/ang/type iso
/gps/number 1
/run/beamOn 1000000000
The macro I have sent is for rdecay01 : G4radioctiveDecay alone.
on the output there are only 3 e+ over 100000 events. The decay I128 -> Te128 is by electronic capture
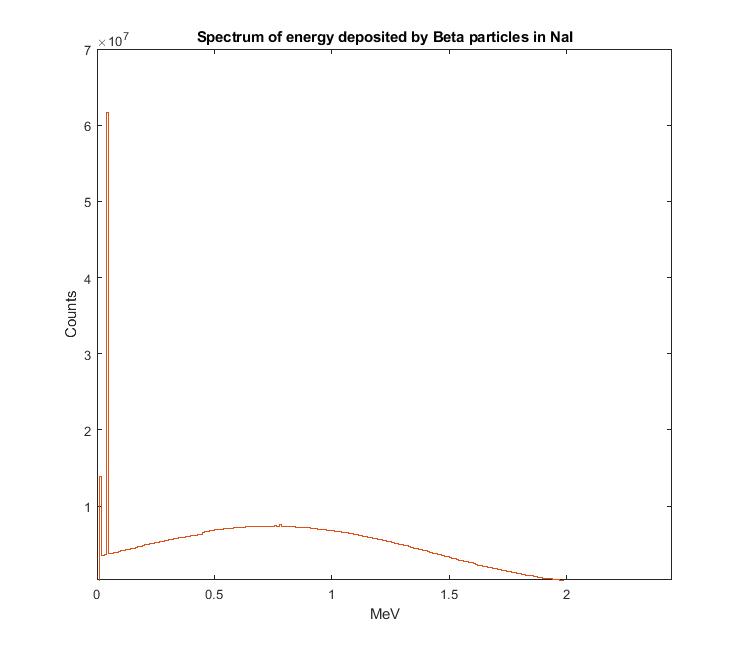
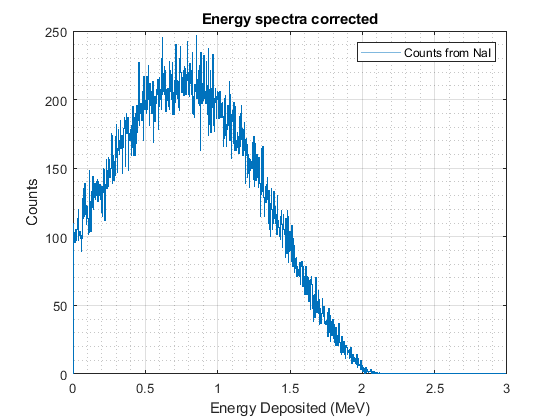
I modeled the I-128 source in NaI and attained energy spectrum, It seems that except at two bins it looks perfectly fine, at two low energy bins it shows overshoots. My physics list is QGSP_BIC_HP which has G4RadioactiveDecay. I do not understand the reason for these two peaks, I would be grateful to know the resolution for this.
I also tried using e- filter to get rid of these overshoots. But it doesn’t help.
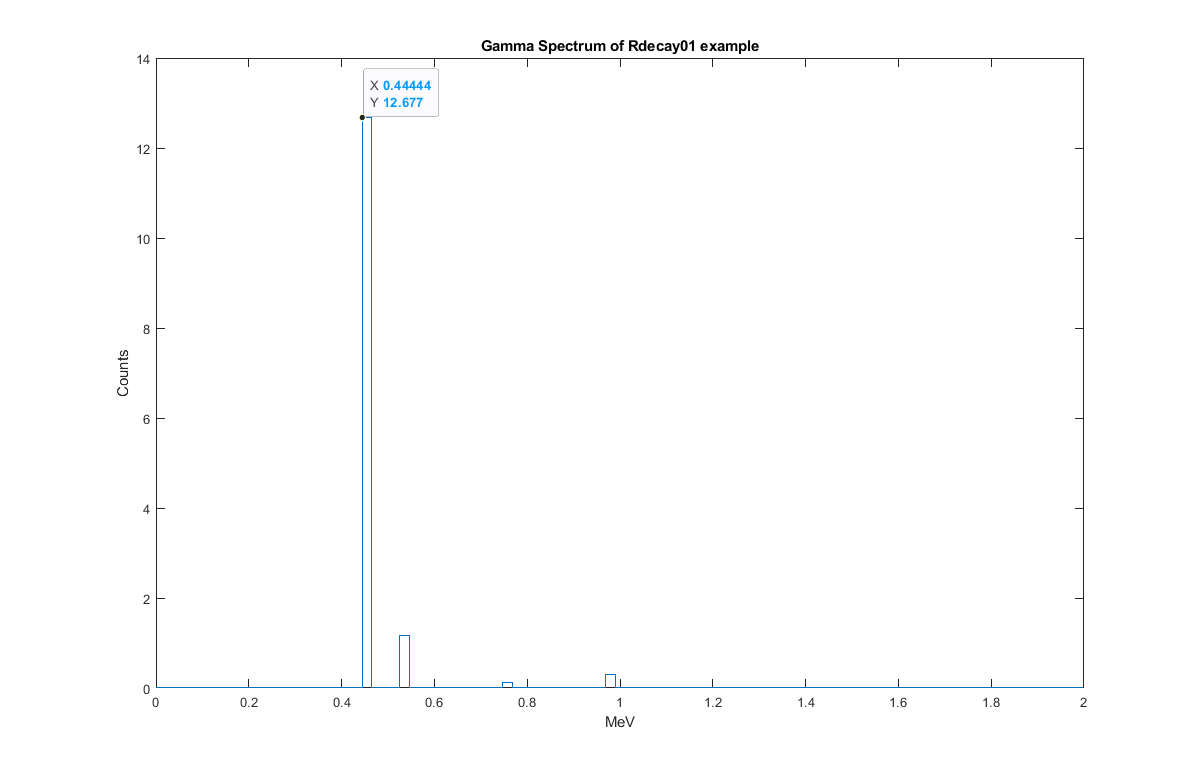
I tried the above attached macro and compared it with my G4 spectrum. The peak in the beta spectrum in NaI is at 0.0408 MeV while the peak in gamma spectracfrom your macro is at 0.444 MeV. I ave attached both images.
Could this be a physics issue? Or is this a genuine artifact of NaI detectors? The K-edge for Na is approx 1KeV and K-edge for Iodine is approx. 33 KeV. So I do not think this is due to that. Please let me know what could be done to resolve this. For your reference I am sending you my source code. I would be grateful if you can provide me some insight.
I was wrong in my suggestion. Gamma from nuclear deexcition suffer photoelectric and Compton interactions and, finally, do not make a peak in the energy deposited spectrum.
What you see is low energy electrons (Auger e-) from the electronic cloud rearrangement mechanism (ARM) which follow an electronic capture.
ARM is active in G4RadioactiveDecayPhysics, but is switched off in example rdecay01 (line 112 of PhysicsList).
After activating it, I get similar plot to you.
It appears that the RDM messenger includes a macro command for this, /grdm/applyARM [true|false]. That should do what you want without having to modify the toolkit.
About example rdecay02 : your mail seems private; we cannot answer directly to it.
I am not sure to understand what /grdm/sourceTimeProfile is supposed to do …
if you have time, you may open a bug report.
Please, have a look at example Activation (in the same subdirectory), with the attached macro.
Set a beam time is simple : lines 102-105 of PrimaryGeneratorAction.cc I128.mac.txt (583 Bytes)