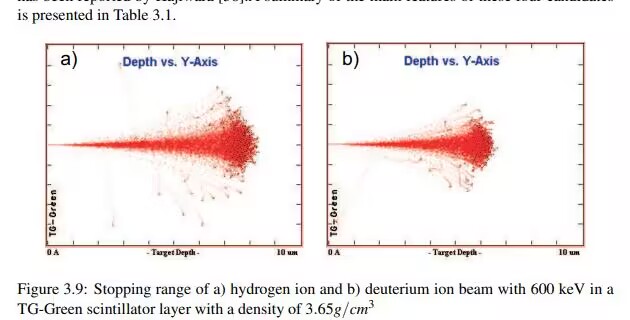
Can root draw a figure like this?

If the data is a simple (x,y) point set, then it should be possible using a TGraph.
I read
\examples\advanced\brachytherapy
And find the example in
\examples\advanced\brachytherapy\comparison\compare.cc
I find out that this TGraph only read the data from existing files and then drawn.
In geant4,dose one can only use the method in G4VAnalysisManager.cc to create a figure?
There is some plotting functionality available (thus why I’ve moved it to the relevant forum for the xperts to help), however, personally I would always output the raw data to file and plot separately. This gives far more freedom in what you can do/use/adjust, and if the simulation to generate the data takes significant time, you won’t need to rerun it each time you want to adjust the plot parameters.
So, can I output the coordinates of each step to the txt file in SteppingAction, and then use other software (e.g. MatLab)to process the data?
Yes, I think (but I defer to @ivana on this) you’ve just use G4AnalysisManager as usual, and output to the format of your choice. The extended examples TestEM1 and TestEm3 show this kind of use in a stepping action.
Better than writing your own text file and then having to parse it, use G4AnalysisManager to create an N-tuple. Store the information you want (I’d recommend lots of information!), then you can use ROOT offline to make plots, correlations, integrals, whatever you need.
Some useful information from the steps for an offline analysis might be
- EventID
- TrackID
- StepID
- Parent TrackID
- Particle Type (PDG Code or Name)
- Position
- Volume Name
- Kinetic Energy
- Momentum
- Energy Deposited
Hi mojingshihua
It seems to me there are two issues here - maybe three:
-
You want to see the trajectories of particles as in your attached image file, any viewer will show this if you
/vis/scene/add/trajectories, and/vis/scene/endOfEventAction accumulate- see examples/basic/B1. -
As suggested, use G4AnalysisManager to accumulate information. N-tuples are a good way. If you accumulate histograms, you may view them with
/vis/plotat end of run - see advice printed at end of run. -
If you do actually write something to file for yourself in a SteppingAction in multithreading mode, protect it with a mutex (mutually exclude), since there is a SteppingAction for each thread, for if you don’t, the output will get mangled by different SteppingActions trying to write to the same file at the same time.
#include "G4Threading.hh"
...
    // Always use a lock when writing a file in MT mode
    G4Mutex eventsFileMutex = G4MUTEX_INITIALIZER;
    G4AutoLock lock(&eventsFileMutex);
John
I want to store the position of each step,and see the probably max penetration depth from the figure of trajectory.
We have given you lots of pointers and advice. It is up to you, now, to program what you want.
Hello,
The answer is yes: ROOT can produce such plots, and you can use G4AnalysisManager to save your data in a form suitable for your analysis.
As @mkelsey pointed above, you can use an n-tuple to save a position (and other quantities that you need) and then post-process your output file in ROOT.
Or another possibility is to define a suitable histogram that you will fill during your simulation and then just display with ROOT or with Geant4 plotting.
But this depends on what you want to display; if you want to see the complete particle trajectories, and then you should use the visualization system, or if you want to see the statistics of the stopping positions, then you use the analysis tools.
Best regards,
Thanks,this really help
Yes,I will use an ntuple,thanks for advice!