test38.txt (805 Bytes) the reference example
gpsneutron.txt (2.7 KB) the original spectrum
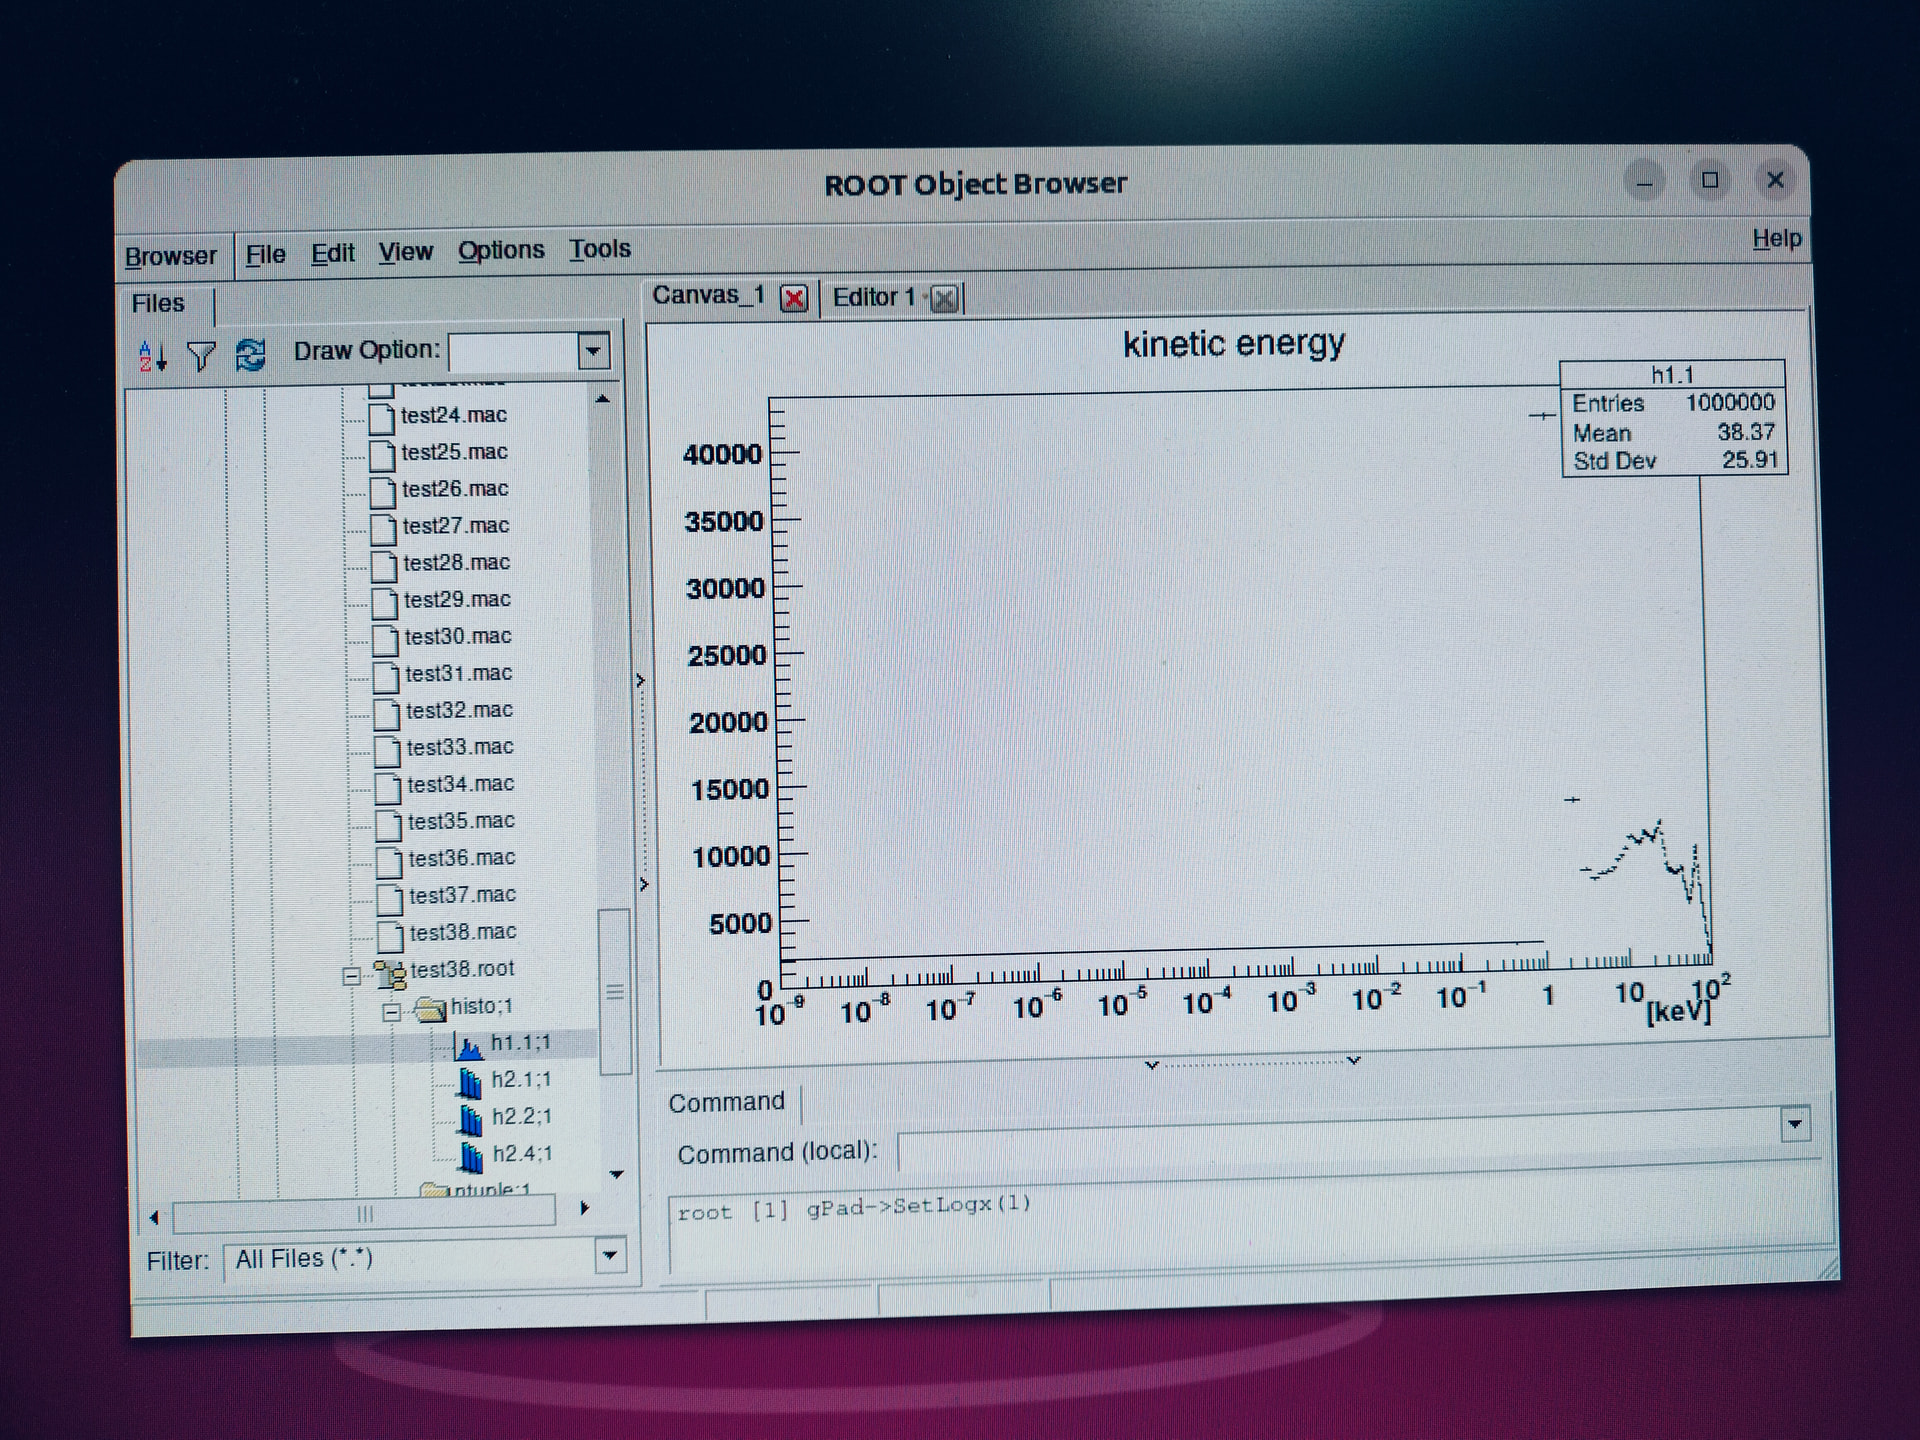
using the example extend eventgeneration expgs test38 as input energy specteum, the result as show, it is wrong, who can give me suggestion where did this peogram go wrong
Your explanation seems a bit loose… I am not familiar with the example you mention. Could you further explain what the problem is?
Without even going further, I can pinpoint two comments:
thank you bro, the keypoint is scale set, the energy spectrum is ok ,