Run getting killed in magnetic field simulation

Hello,
I have a beam line simulation with 4 quadrupoles and three dipoles with the magnetic fields being read from separate files for all the magnets. The simulation runs for few events and the positions are also as expected from the magnetic field definition but the run is getting killed after about 12 events. The crash is not at the same point always. For the magnetic field I adapted the TabulatedField3D.cc as given in the advanced purging magnet example and the field calculations seem to be working fine. But I am not sure why the run is getting killed every time. In the detector construction I have defined the fields like:

field_Q29= new TabulatedElementField3D(…);
field_Q30= new TabulatedElementField3D("…);

  //This is thread-local

fEquation_Q29 = new G4Mag_UsualEqRhs (field_Q29);
fFieldMgr_Q29 = G4TransportationManager::GetTransportationManager()->GetFieldManager();

fStepper_Q29 = new G4ClassicalRK4 (fEquation_Q29);
fFieldMgr_Q29 = new G4FieldManager(field_Q29);
fChordFinder_Q29 = new G4ChordFinder(field_Q29,1*mm,fStepper_Q29);
fFieldMgr_Q29->SetChordFinder(fChordFinder_Q29);

fEquation_Q30 = new G4Mag_UsualEqRhs (field_Q30);
fFieldMgr_Q30 = G4TransportationManager::GetTransportationManager()->GetFieldManager();

fStepper_Q30 = new G4ClassicalRK4 (fEquation_Q30);
fFieldMgr_Q30 = new G4FieldManager(field_Q30);
fChordFinder_Q30 = new G4ChordFinder(field_Q30,1*mm,fStepper_Q30);
fFieldMgr_Q30->SetChordFinder(fChordFinder_Q30);

logical_Q29->SetFieldManager(fFieldMgr_Q29, true);

logical_Q30->SetFieldManager(fFieldMgr_Q30, true);

I have checked the geometry overlap as well and that is ok. I do have a complicated geometry with boolean solids. But the run works for few (10-12) events. Please let me know how I can fix this as I am not sure why exactly it crashes…

Thank you very much in advance. Any help is appreciated. I am kind of stuck at this point.

Best,
Dipanwita

Just to add some more details my magnetic field class is written such that the field is translated according to the logical volume that the field is attached to. I am also deleting my field and field manger in the destructor of my detector construction. Please let me know if I should provide any more details. My simulation runs fine for about 13 events then it crashes. Its most probably due to some memory leak but I am really not sure where the problem is. Any help is very much appreciated. Thank you in advance,

Best Regards,
Dipanwita

Dear Dipanwita,

The code which you write seems fine - I do not see a problem in the magnetic field definition. It’s code is only called once at the start of a run for each thread anyway, so it does not seem likely that it will cause a memory leak. If you wanted to be 100% sure, you could reduce the number of field elements by a factor of 2-4x and see whether the number of events which work increases.

But that would not be definitive, in case the path of a track was very different.

I suggest to look at other parts of your program for a likely cause. And to use a different way to monitor the amount of memory used by your program. If you are on Unix (Linux/Mac) you look at the output of ‘top’ or ps to identify the memory used by the program, for example.

Beyond that, without more information about how your crash / problem occurs, and in particular without the signal or printout from a crash, it is difficult to give any suggestions.

When I have had similar problems I have run the program from within a debugger - gdb or lately lldb. A graphical debugger that uses one of these will do great too. Then at least you can report where in the program an issue occurs.

Best regards,
John

Dear John,
Thank you so much for your reply. I was trying to check with gdb but its getting stuck. So I basically get stuck at the message New Thread. Am I missing something ?

sudo gdb ./FieldTest

Password:

GNU gdb (GDB) 9.2

Copyright © 2020 Free Software Foundation, Inc.

License GPLv3+: GNU GPL version 3 or later http://gnu.org/licenses/gpl.html

This is free software: you are free to change and redistribute it.

There is NO WARRANTY, to the extent permitted by law.

Type “show copying” and “show warranty” for details.

This GDB was configured as “x86_64-apple-darwin19.4.0”.

Type “show configuration” for configuration details.

For bug reporting instructions, please see:

http://www.gnu.org/software/gdb/bugs/.

Find the GDB manual and other documentation resources online at:

http://www.gnu.org/software/gdb/documentation/.

For help, type “help”.

Type “apropos word” to search for commands related to “word”…

Reading symbols from ./FieldTest…

(gdb) run

Starting program: /Users/dipanwitabanerjee/Documents/EHN2_Docs/BMS_MomRecon/Geant4/FieldVis_Build/FieldTest

[New Thread 0xe03 of process 59090]

Just to add I checked the activity monitor when the program is running and this is the memory usage

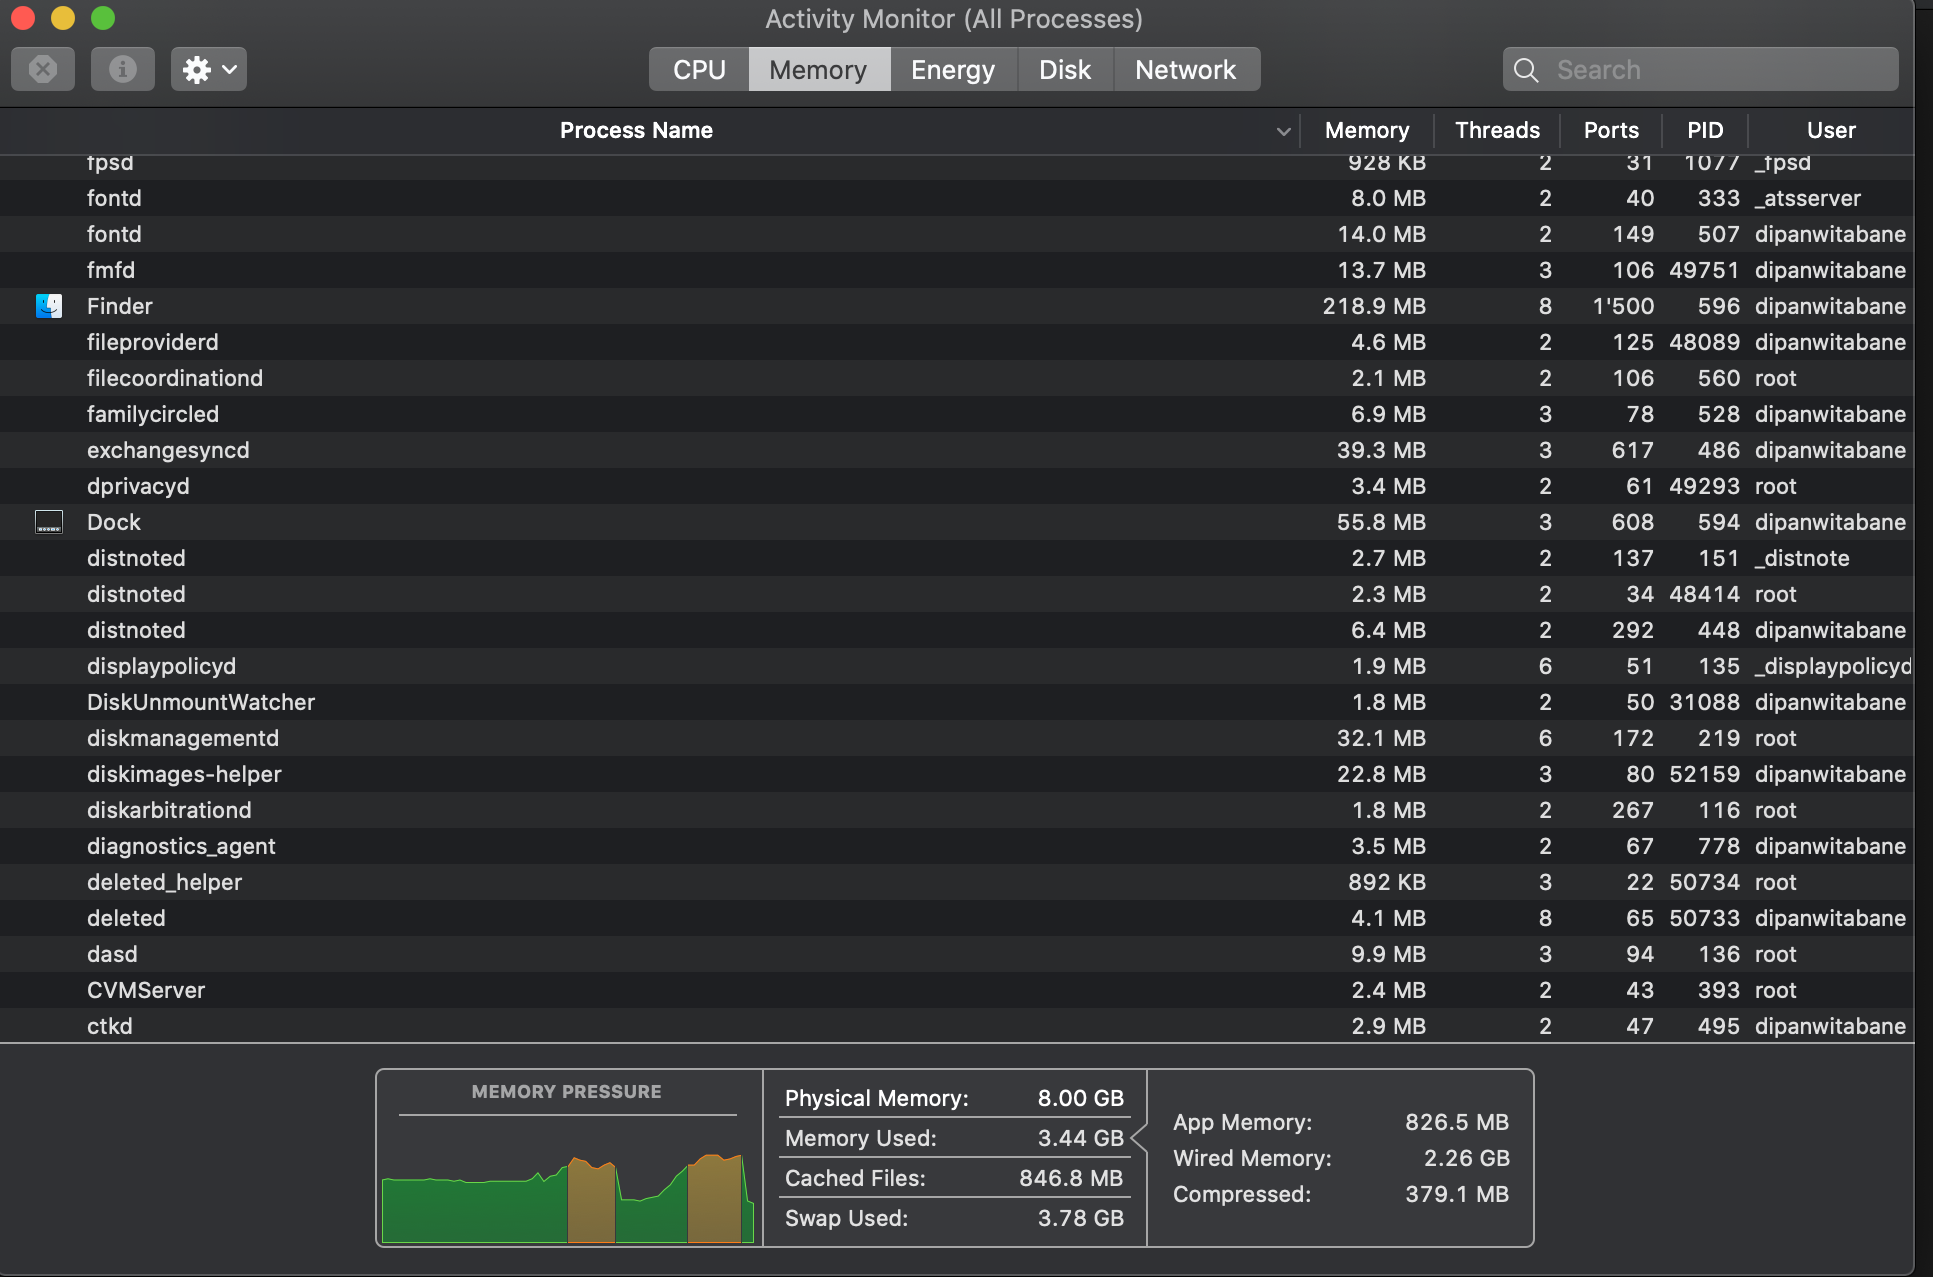
The two red chunks are basically when the program was running. Please let me know how I can better use the debugger tool. I think this will help a lot. Thank you very much in advance…

I tried running valgrind and this is the output I get:

valgrind -s ./FieldTest
==60702== Memcheck, a memory error detector
==60702== Copyright © 2002-2017, and GNU GPL’d, by Julian Seward et al.
==60702== Using Valgrind-3.16.0.GIT and LibVEX; rerun with -h for copyright info
==60702== Command: ./FieldTest
==60702==
==60702== Syscall param mach_msg(trailer->msgh_trailer_size) points to unaddressable byte(s)
==60702== at 0x10380BDFA: mach_msg_trap (in /usr/lib/system/libsystem_kernel.dylib)
==60702== by 0x10380C16F: mach_msg (in /usr/lib/system/libsystem_kernel.dylib)
==60702== by 0x1038EAA6C: _xpc_pipe_routine (in /usr/lib/system/libxpc.dylib)
==60702== by 0x1038CFBF1: xpc_pipe_routine_with_flags (in /usr/lib/system/libxpc.dylib)
==60702== by 0x1038CFA7D: _xpc_interface_routine (in /usr/lib/system/libxpc.dylib)
==60702== by 0x1038D1D77: bootstrap_look_up3 (in /usr/lib/system/libxpc.dylib)
==60702== by 0x1038D1BA9: bootstrap_look_up2 (in /usr/lib/system/libxpc.dylib)
==60702== by 0x1037E7301: _notify_fork_child (in /usr/lib/system/libsystem_notify.dylib)
==60702== by 0x10348C657: _dispatch_client_callout (in /usr/lib/system/libdispatch.dylib)
==60702== by 0x10348D7DD: _dispatch_once_callout (in /usr/lib/system/libdispatch.dylib)
==60702== by 0x1037E729D: _notify_fork_child (in /usr/lib/system/libsystem_notify.dylib)
==60702== by 0x1037E5597: notify_monitor_file (in /usr/lib/system/libsystem_notify.dylib)
==60702== Address 0x116f51a00 is 0 bytes after a block of size 384 alloc’d
==60702== at 0x10014EC90: calloc (in /usr/local/Cellar/valgrind/HEAD-36f444c/lib/valgrind/vgpreload_memcheck-amd64-darwin.so)
==60702== by 0x103933667: objc_msgSend_stret (in /usr/lib/libobjc.A.dylib)
==60702== by 0x10348BFEC: _os_object_alloc_realized (in /usr/lib/system/libdispatch.dylib)
==60702== by 0x1034A2ED2: dispatch_mach_msg_create (in /usr/lib/system/libdispatch.dylib)
==60702== by 0x1038CFEDF: _xpc_serializer_pack (in /usr/lib/system/libxpc.dylib)
==60702== by 0x1038CFD38: _xpc_pipe_pack_message (in /usr/lib/system/libxpc.dylib)
==60702== by 0x1038EA9CE: _xpc_pipe_routine (in /usr/lib/system/libxpc.dylib)
==60702== by 0x1038CFBF1: xpc_pipe_routine_with_flags (in /usr/lib/system/libxpc.dylib)
==60702== by 0x1038CFA7D: _xpc_interface_routine (in /usr/lib/system/libxpc.dylib)
==60702== by 0x1038D1D77: bootstrap_look_up3 (in /usr/lib/system/libxpc.dylib)
==60702== by 0x1038D1BA9: bootstrap_look_up2 (in /usr/lib/system/libxpc.dylib)
==60702== by 0x1037E7301: _notify_fork_child (in /usr/lib/system/libsystem_notify.dylib)
==60702==
==60702== Syscall param mach_msg(trailer->msgh_trailer_type) points to uninitialised byte(s)
==60702== at 0x10380BDFA: mach_msg_trap (in /usr/lib/system/libsystem_kernel.dylib)
==60702== by 0x10380C16F: mach_msg (in /usr/lib/system/libsystem_kernel.dylib)
==60702== by 0x1037E712C: _notify_fork_child (in /usr/lib/system/libsystem_notify.dylib)
==60702== by 0x1037E5597: notify_monitor_file (in /usr/lib/system/libsystem_notify.dylib)
==60702== by 0x1037E27E5: notify_register_check (in /usr/lib/system/libsystem_notify.dylib)
==60702== by 0x1036CE901: __si_module_static_ds_block_invoke (in /usr/lib/system/libsystem_info.dylib)
==60702== by 0x10348C657: _dispatch_client_callout (in /usr/lib/system/libdispatch.dylib)
==60702== by 0x10348D7DD: _dispatch_once_callout (in /usr/lib/system/libdispatch.dylib)
==60702== by 0x1036CE838: si_module_static_ds (in /usr/lib/system/libsystem_info.dylib)
==60702== by 0x1036CE0E3: si_module_with_name (in /usr/lib/system/libsystem_info.dylib)
==60702== by 0x1036CE644: si_module_config_modules_for_category (in /usr/lib/system/libsystem_info.dylib)
==60702== by 0x1036CE3B4: __si_module_static_search_block_invoke (in /usr/lib/system/libsystem_info.dylib)
==60702== Address 0x1049401c0 is on thread 1’s stack
==60702== in frame #2, created by _notify_fork_child (???:slight_smile:
==60702==
==60702== Syscall param mach_msg(trailer->msgh_trailer_size) points to uninitialised byte(s)
==60702== at 0x10380BDFA: mach_msg_trap (in /usr/lib/system/libsystem_kernel.dylib)
==60702== by 0x10380C16F: mach_msg (in /usr/lib/system/libsystem_kernel.dylib)
==60702== by 0x1037E712C: _notify_fork_child (in /usr/lib/system/libsystem_notify.dylib)
==60702== by 0x1037E5597: notify_monitor_file (in /usr/lib/system/libsystem_notify.dylib)
==60702== by 0x1037E27E5: notify_register_check (in /usr/lib/system/libsystem_notify.dylib)
==60702== by 0x1036CE901: __si_module_static_ds_block_invoke (in /usr/lib/system/libsystem_info.dylib)
==60702== by 0x10348C657: _dispatch_client_callout (in /usr/lib/system/libdispatch.dylib)
==60702== by 0x10348D7DD: _dispatch_once_callout (in /usr/lib/system/libdispatch.dylib)
==60702== by 0x1036CE838: si_module_static_ds (in /usr/lib/system/libsystem_info.dylib)
==60702== by 0x1036CE0E3: si_module_with_name (in /usr/lib/system/libsystem_info.dylib)
==60702== by 0x1036CE644: si_module_config_modules_for_category (in /usr/lib/system/libsystem_info.dylib)
==60702== by 0x1036CE3B4: __si_module_static_search_block_invoke (in /usr/lib/system/libsystem_info.dylib)
==60702== Address 0x1049401c4 is on thread 1’s stack
==60702== in frame #2, created by _notify_fork_child (???:slight_smile:
==60702==
==60702== Syscall param mach_msg(trailer->msgh_trailer_size) points to unaddressable byte(s)
==60702== at 0x10380BDFA: mach_msg_trap (in /usr/lib/system/libsystem_kernel.dylib)
==60702== by 0x10380C16F: mach_msg (in /usr/lib/system/libsystem_kernel.dylib)
==60702== by 0x1038EAA6C: _xpc_pipe_routine (in /usr/lib/system/libxpc.dylib)
==60702== by 0x1038CFC9F: xpc_pipe_routine (in /usr/lib/system/libxpc.dylib)
==60702== by 0x1036CDCE2: _od_rpc_call (in /usr/lib/system/libsystem_info.dylib)
==60702== by 0x1036CF612: _ds_item (in /usr/lib/system/libsystem_info.dylib)
==60702== by 0x1036CF2B9: ds_user_byuid (in /usr/lib/system/libsystem_info.dylib)
==60702== by 0x1036CECBB: si_user_byuid (in /usr/lib/system/libsystem_info.dylib)
==60702== by 0x1036CED9E: search_item_bynumber (in /usr/lib/system/libsystem_info.dylib)
==60702== by 0x1036CECF6: search_user_byuid (in /usr/lib/system/libsystem_info.dylib)
==60702== by 0x1036CECBB: si_user_byuid (in /usr/lib/system/libsystem_info.dylib)
==60702== by 0x1036D4A2C: getpwuid_r (in /usr/lib/system/libsystem_info.dylib)
==60702== Address 0x116f6b310 is 0 bytes after a block of size 208 alloc’d
==60702== at 0x10014EC90: calloc (in /usr/local/Cellar/valgrind/HEAD-36f444c/lib/valgrind/vgpreload_memcheck-amd64-darwin.so)
==60702== by 0x103933667: objc_msgSend_stret (in /usr/lib/libobjc.A.dylib)
==60702== by 0x10348BFEC: _os_object_alloc_realized (in /usr/lib/system/libdispatch.dylib)
==60702== by 0x1034A2ED2: dispatch_mach_msg_create (in /usr/lib/system/libdispatch.dylib)
==60702== by 0x1038CFEDF: _xpc_serializer_pack (in /usr/lib/system/libxpc.dylib)
==60702== by 0x1038CFD38: _xpc_pipe_pack_message (in /usr/lib/system/libxpc.dylib)
==60702== by 0x1038EA9CE: _xpc_pipe_routine (in /usr/lib/system/libxpc.dylib)
==60702== by 0x1038CFC9F: xpc_pipe_routine (in /usr/lib/system/libxpc.dylib)
==60702== by 0x1036CDCE2: _od_rpc_call (in /usr/lib/system/libsystem_info.dylib)
==60702== by 0x1036CF612: _ds_item (in /usr/lib/system/libsystem_info.dylib)
==60702== by 0x1036CF2B9: ds_user_byuid (in /usr/lib/system/libsystem_info.dylib)
==60702== by 0x1036CECBB: si_user_byuid (in /usr/lib/system/libsystem_info.dylib)
==60702==
UNKNOWN workq_ops option 1024
==60702== Thread 2:
==60702== Invalid read of size 4
==60702== at 0x10386CC10: _pthread_wqthread_setup (in /usr/lib/system/libsystem_pthread.dylib)
==60702== by 0x10386C942: _pthread_wqthread (in /usr/lib/system/libsystem_pthread.dylib)
==60702== by 0x10386BB76: start_wqthread (in /usr/lib/system/libsystem_pthread.dylib)
==60702== Address 0x18 is not stack’d, malloc’d or (recently) free’d
==60702==
==60702==
==60702== Process terminating with default action of signal 11 (SIGSEGV)
==60702== Access not within mapped region at address 0x18
==60702== at 0x10386CC10: _pthread_wqthread_setup (in /usr/lib/system/libsystem_pthread.dylib)
==60702== by 0x10386C942: pthread_wqthread (in /usr/lib/system/libsystem_pthread.dylib)
==60702== by 0x10386BB76: start_wqthread (in /usr/lib/system/libsystem_pthread.dylib)
==60702== If you believe this happened as a result of a stack
==60702== overflow in your program’s main thread (unlikely but
==60702== possible), you can try to increase the size of the
==60702== main thread stack using the --main-stacksize= flag.
==60702== The main thread stack size used in this run was 8388608.
–60702:0:schedule VG
(sema_down): read returned -4
==60702==
==60702== HEAP SUMMARY:
==60702== in use at exit: 1,505,113 bytes in 1,660 blocks
==60702== total heap usage: 2,159 allocs, 499 frees, 2,842,521 bytes allocated
==60702==
==60702== LEAK SUMMARY:
==60702== definitely lost: 0 bytes in 0 blocks
==60702== indirectly lost: 0 bytes in 0 blocks
==60702== possibly lost: 322,232 bytes in 480 blocks
==60702== still reachable: 1,182,881 bytes in 1,180 blocks
==60702== suppressed: 0 bytes in 0 blocks
==60702== Rerun with --leak-check=full to see details of leaked memory
==60702==
==60702== Use --track-origins=yes to see where uninitialised values come from
==60702== ERROR SUMMARY: 6 errors from 5 contexts (suppressed: 50 from 4)
==60702==
==60702== 1 errors in context 1 of 5:
==60702== Invalid read of size 4
==60702== at 0x10386CC10: _pthread_wqthread_setup (in /usr/lib/system/libsystem_pthread.dylib)
==60702== by 0x10386C942: _pthread_wqthread (in /usr/lib/system/libsystem_pthread.dylib)
==60702== by 0x10386BB76: start_wqthread (in /usr/lib/system/libsystem_pthread.dylib)
==60702== Address 0x18 is not stack’d, malloc’d or (recently) free’d
==60702==
==60702==
==60702== 1 errors in context 2 of 5:
==60702== Thread 1:
==60702== Syscall param mach_msg(trailer->msgh_trailer_size) points to unaddressable byte(s)
==60702== at 0x10380BDFA: mach_msg_trap (in /usr/lib/system/libsystem_kernel.dylib)
==60702== by 0x10380C16F: mach_msg (in /usr/lib/system/libsystem_kernel.dylib)
==60702== by 0x1038EAA6C: _xpc_pipe_routine (in /usr/lib/system/libxpc.dylib)
==60702== by 0x1038CFC9F: xpc_pipe_routine (in /usr/lib/system/libxpc.dylib)
==60702== by 0x1036CDCE2: _od_rpc_call (in /usr/lib/system/libsystem_info.dylib)
==60702== by 0x1036CF612: _ds_item (in /usr/lib/system/libsystem_info.dylib)
==60702== by 0x1036CF2B9: ds_user_byuid (in /usr/lib/system/libsystem_info.dylib)
==60702== by 0x1036CECBB: si_user_byuid (in /usr/lib/system/libsystem_info.dylib)
==60702== by 0x1036CED9E: search_item_bynumber (in /usr/lib/system/libsystem_info.dylib)
==60702== by 0x1036CECF6: search_user_byuid (in /usr/lib/system/libsystem_info.dylib)
==60702== by 0x1036CECBB: si_user_byuid (in /usr/lib/system/libsystem_info.dylib)
==60702== by 0x1036D4A2C: getpwuid_r (in /usr/lib/system/libsystem_info.dylib)
==60702== Address 0x116f6b310 is 0 bytes after a block of size 208 alloc’d
==60702== at 0x10014EC90: calloc (in /usr/local/Cellar/valgrind/HEAD-36f444c/lib/valgrind/vgpreload_memcheck-amd64-darwin.so)
==60702== by 0x103933667: objc_msgSend_stret (in /usr/lib/libobjc.A.dylib)
==60702== by 0x10348BFEC: _os_object_alloc_realized (in /usr/lib/system/libdispatch.dylib)
==60702== by 0x1034A2ED2: dispatch_mach_msg_create (in /usr/lib/system/libdispatch.dylib)
==60702== by 0x1038CFEDF: _xpc_serializer_pack (in /usr/lib/system/libxpc.dylib)
==60702== by 0x1038CFD38: _xpc_pipe_pack_message (in /usr/lib/system/libxpc.dylib)
==60702== by 0x1038EA9CE: _xpc_pipe_routine (in /usr/lib/system/libxpc.dylib)
==60702== by 0x1038CFC9F: xpc_pipe_routine (in /usr/lib/system/libxpc.dylib)
==60702== by 0x1036CDCE2: _od_rpc_call (in /usr/lib/system/libsystem_info.dylib)
==60702== by 0x1036CF612: _ds_item (in /usr/lib/system/libsystem_info.dylib)
==60702== by 0x1036CF2B9: ds_user_byuid (in /usr/lib/system/libsystem_info.dylib)
==60702== by 0x1036CECBB: si_user_byuid (in /usr/lib/system/libsystem_info.dylib)
==60702==
==60702==
==60702== 1 errors in context 3 of 5:
==60702== Syscall param mach_msg(trailer->msgh_trailer_size) points to uninitialised byte(s)
==60702== at 0x10380BDFA: mach_msg_trap (in /usr/lib/system/libsystem_kernel.dylib)
==60702== by 0x10380C16F: mach_msg (in /usr/lib/system/libsystem_kernel.dylib)
==60702== by 0x1037E712C: _notify_fork_child (in /usr/lib/system/libsystem_notify.dylib)
==60702== by 0x1037E5597: notify_monitor_file (in /usr/lib/system/libsystem_notify.dylib)
==60702== by 0x1037E27E5: notify_register_check (in /usr/lib/system/libsystem_notify.dylib)
==60702== by 0x1036CE901: __si_module_static_ds_block_invoke (in /usr/lib/system/libsystem_info.dylib)
==60702== by 0x10348C657: _dispatch_client_callout (in /usr/lib/system/libdispatch.dylib)
==60702== by 0x10348D7DD: _dispatch_once_callout (in /usr/lib/system/libdispatch.dylib)
==60702== by 0x1036CE838: si_module_static_ds (in /usr/lib/system/libsystem_info.dylib)
==60702== by 0x1036CE0E3: si_module_with_name (in /usr/lib/system/libsystem_info.dylib)
==60702== by 0x1036CE644: si_module_config_modules_for_category (in /usr/lib/system/libsystem_info.dylib)
==60702== by 0x1036CE3B4: __si_module_static_search_block_invoke (in /usr/lib/system/libsystem_info.dylib)
==60702== Address 0x1049401c4 is on thread 1’s stack
==60702== in frame #2, created by _notify_fork_child (???:slight_smile:
==60702==
==60702==
==60702== 1 errors in context 4 of 5:
==60702== Syscall param mach_msg(trailer->msgh_trailer_type) points to uninitialised byte(s)
==60702== at 0x10380BDFA: mach_msg_trap (in /usr/lib/system/libsystem_kernel.dylib)
==60702== by 0x10380C16F: mach_msg (in /usr/lib/system/libsystem_kernel.dylib)
==60702== by 0x1037E712C: _notify_fork_child (in /usr/lib/system/libsystem_notify.dylib)
==60702== by 0x1037E5597: notify_monitor_file (in /usr/lib/system/libsystem_notify.dylib)
==60702== by 0x1037E27E5: notify_register_check (in /usr/lib/system/libsystem_notify.dylib)
==60702== by 0x1036CE901: __si_module_static_ds_block_invoke (in /usr/lib/system/libsystem_info.dylib)
==60702== by 0x10348C657: _dispatch_client_callout (in /usr/lib/system/libdispatch.dylib)
==60702== by 0x10348D7DD: _dispatch_once_callout (in /usr/lib/system/libdispatch.dylib)
==60702== by 0x1036CE838: si_module_static_ds (in /usr/lib/system/libsystem_info.dylib)
==60702== by 0x1036CE0E3: si_module_with_name (in /usr/lib/system/libsystem_info.dylib)
==60702== by 0x1036CE644: si_module_config_modules_for_category (in /usr/lib/system/libsystem_info.dylib)
==60702== by 0x1036CE3B4: __si_module_static_search_block_invoke (in /usr/lib/system/libsystem_info.dylib)
==60702== Address 0x1049401c0 is on thread 1’s stack
==60702== in frame #2, created by _notify_fork_child (???:slight_smile:
==60702==
==60702==
==60702== 2 errors in context 5 of 5:
==60702== Syscall param mach_msg(trailer->msgh_trailer_size) points to unaddressable byte(s)
==60702== at 0x10380BDFA: mach_msg_trap (in /usr/lib/system/libsystem_kernel.dylib)
==60702== by 0x10380C16F: mach_msg (in /usr/lib/system/libsystem_kernel.dylib)
==60702== by 0x1038EAA6C: _xpc_pipe_routine (in /usr/lib/system/libxpc.dylib)
==60702== by 0x1038CFBF1: xpc_pipe_routine_with_flags (in /usr/lib/system/libxpc.dylib)
==60702== by 0x1038CFA7D: _xpc_interface_routine (in /usr/lib/system/libxpc.dylib)
==60702== by 0x1038D1D77: bootstrap_look_up3 (in /usr/lib/system/libxpc.dylib)
==60702== by 0x1038D1BA9: bootstrap_look_up2 (in /usr/lib/system/libxpc.dylib)
==60702== by 0x1037E7301: _notify_fork_child (in /usr/lib/system/libsystem_notify.dylib)
==60702== by 0x10348C657: _dispatch_client_callout (in /usr/lib/system/libdispatch.dylib)
==60702== by 0x10348D7DD: _dispatch_once_callout (in /usr/lib/system/libdispatch.dylib)
==60702== by 0x1037E729D: _notify_fork_child (in /usr/lib/system/libsystem_notify.dylib)
==60702== by 0x1037E5597: notify_monitor_file (in /usr/lib/system/libsystem_notify.dylib)
==60702== Address 0x116f51a00 is 0 bytes after a block of size 384 alloc’d
==60702== at 0x10014EC90: calloc (in /usr/local/Cellar/valgrind/HEAD-36f444c/lib/valgrind/vgpreload_memcheck-amd64-darwin.so)
==60702== by 0x103933667: objc_msgSend_stret (in /usr/lib/libobjc.A.dylib)
==60702== by 0x10348BFEC: _os_object_alloc_realized (in /usr/lib/system/libdispatch.dylib)
==60702== by 0x1034A2ED2: dispatch_mach_msg_create (in /usr/lib/system/libdispatch.dylib)
==60702== by 0x1038CFEDF: _xpc_serializer_pack (in /usr/lib/system/libxpc.dylib)
==60702== by 0x1038CFD38: _xpc_pipe_pack_message (in /usr/lib/system/libxpc.dylib)
==60702== by 0x1038EA9CE: _xpc_pipe_routine (in /usr/lib/system/libxpc.dylib)
==60702== by 0x1038CFBF1: xpc_pipe_routine_with_flags (in /usr/lib/system/libxpc.dylib)
==60702== by 0x1038CFA7D: _xpc_interface_routine (in /usr/lib/system/libxpc.dylib)
==60702== by 0x1038D1D77: bootstrap_look_up3 (in /usr/lib/system/libxpc.dylib)
==60702== by 0x1038D1BA9: bootstrap_look_up2 (in /usr/lib/system/libxpc.dylib)
==60702== by 0x1037E7301: _notify_fork_child (in /usr/lib/system/libsystem_notify.dylib)
==60702==
–60702–
–60702-- used_suppression: 11 OSX1015:dyld-1 /usr/local/Cellar/valgrind/HEAD-36f444c/lib/valgrind/default.supp:726
–60702-- used_suppression: 22 OSX1015:dyld-3 /usr/local/Cellar/valgrind/HEAD-36f444c/lib/valgrind/default.supp:743
–60702-- used_suppression: 17 OSX1015:dyld-2 /usr/local/Cellar/valgrind/HEAD-36f444c/lib/valgrind/default.supp:734
==60702==
==60702== ERROR SUMMARY: 6 errors from 5 contexts (suppressed: 50 from 4)

How can I compile the code such that valgrind includes the line numbers in the output. So something similar to the -g option for compiling … Thank you in advance for any help…

Best Regards,
Dipanwita

Dear Dipanwita,

I suggest to compile and run an unchanged example program, for example basic B1, with your installation to check that the installation works. Unless you get the expected results from example programs, it is difficult to get your own program to work.

Once you have a program that is running, using ‘valgrind’ is a reasonable way to diagnose memory issues. And that using Geant4 compiled with debugging is the best way to get the line number of a problem. ( You can also have ‘ReleaseWithDebug’ which is faster but less reliable for finding the cause of an issue. )

For Geant4 installation options, please look at the Geant4 Installation Guide. It has all the instructions, including what to expect. ( There is too much context to repeat the instructions here. )

However I will note that nothing in the dump from valgrind has anything to do with Geant4.

Regarding memory use you will need to look at the RSS column of the ‘top’ output while the program is running. You can note down the values as it is running or try to recall the maximum value.

If you do not have experience using ‘gdb’, you could use a graphical debugger for your system instead. You will need to find a tutorial - again there is too much to give clear instructions.

Regards, John

Dear John,
Thank you so much for all your suggestions. So I reinstalled Geant4 with the debugging options and tried to run example B1 without changes. The example runs with no problem. I then tried valgrind on my code and the output shows some errors and memory leakage in some Geant4 headers and source codes but I couldn’t find anything particular about my code. I also tried gdb but when I run gdb I get the error that the data environment variables aren’t set even though it is. When I just run the executable outside gdb it runs without this exception error. Can you please help to understand why gdb throws this exception even though the path variables are defined ? Please let me know if you have any suggestions as now the example runs but my code still just gets killed. I also checked all geometry overlaps and this all seems ok. Thank you very much in advance. I really appreciate the help…

Best Regards,
Dipanwita

The output of the valgrind is saved here …

https://cernbox.cern.ch/index.php/s/7lMBuMiwEN7lvR3

Dear John,
I just started to build my code from scratch on top of the B1 example and this seems to work fine now. The major change I made was to initialise the pointers to all the solid, logical, physical volumes as well as the field components as null pointers in the detector construction class. Maybe this helped fix the problem. I also removed all messenger classes but I don’t think this was the issue. In any case its not crashing anymore. I checked up to 50 events (before it was crashing at 13). Thank you very much for all your help and suggestions. I really appreciate it…

Best Regards,
Dipanwita