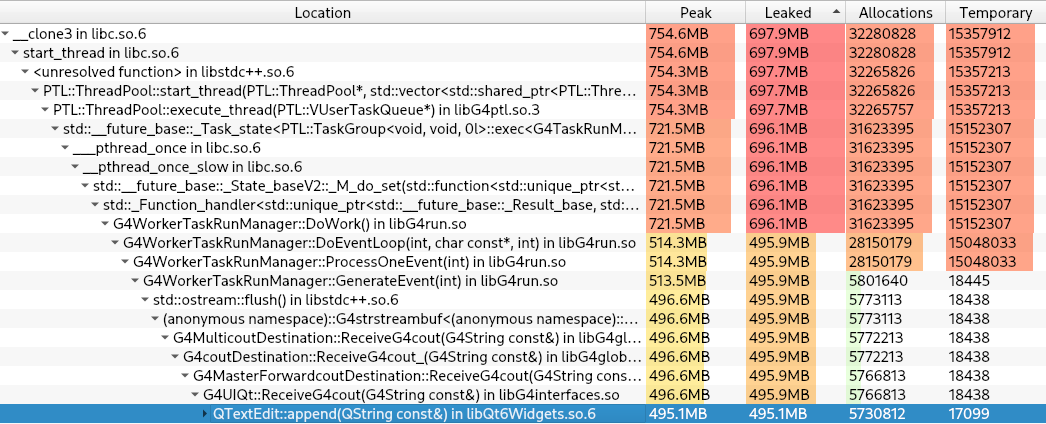
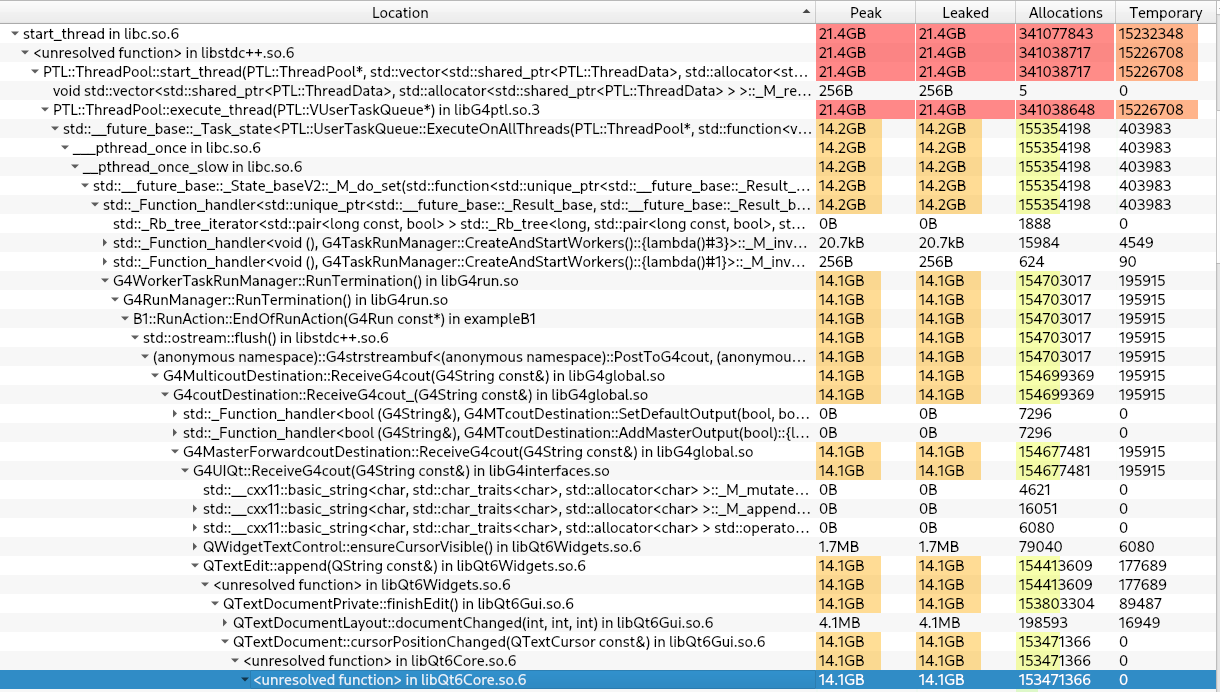
Punchline: Running a simulation with /run/printProgress 1000, 100k events per run, very short time per event (~milliseconds), and a few hundred runs in a row leads to massive memory consumption and can crash the program and my computer. The memory consumption is on order tens of MB/second. This is not so good.
System details
OS Debian 13 kernel 6.12.105
Geant4 v11.4.2
Compiler gcc 14.2.0
CMake 3.31.6
I’m running a simulation based on this Geant4 project: impish/geant.
I stumbled upon this behavior doing simulations of X-rays through hundreds of G4Box slabs of air. But, the behavior is reproduced with just a single G4Box geometry preset in the world volume. The point is there are lots of events generated.
Running them with no debug printing gives a flat memory consumption of max ~1 GB even for a long-running program. Running with /run/printProgress 1000 leads to huge memory consumptions and crashes.
I looked into e.g. G4Allocator, leaks in my own code, etc. The diagnostic tool that was most helpful is called heaptrack which seems to work a lot faster than Valgrind for this sort of thing (?)
Looking at the heaptrack results for my project, it looks like most of the memory is leaking out of G4coutDestination::ReceiveG4cout_ via the Qt interface.
Set a limit on the # of lines stored by the Qt console ?
Do not instantiate a Qt session for noninteractive runs in my project.I am not sure why the Qt interface is used at all during the noninteractive runs. I probably have a bug. I was instantiating the UIExecutive for every run, not just the interactive ones.
I guess this still leaves the question: is this “leak” expected behavior?