Hello, dear Geant4 experts and users!
I have some problems while recording some quantities via “scoring” and sensitive detector tools.
I will write below the order of my application upgrades for best understanding a problem:
1)firstly, my goal was to measure energy that is deposited by some types of particles in the target. I used a sensitive detector to reach this by writing to a file a “step->GetTotalDeposit()” associated with coordinate from “GetPreStepPoint()”. This method gives me a smooth and normal histogramm at this step of application development.
2)my second goal was to record a flux from different particles in and outside of my target. For this I used a scoring manager with a number of bins along Z axis.
The problem appears at this step. When I visualizing a histogram with deposited energy, there are some peaks in it.
It should be noted, that I updated Geant4 from 10.06 to 10.07 between 1) and 2) steps. So firstly I thought that it may be caused by update. Because of this I decided to use scoring manager to record energy deposit simultaneously with Sensitive Detector to validate results.
I have got a good data from scoring manager, but I also noticed that changing number of bins in scoring correlate with number of peaks in distribution from sensitive detector. Literally, number of peaks is equal to bins number minus 1. For example, the are some of this distributions from Sensitive Detector data depending on scoring mode.
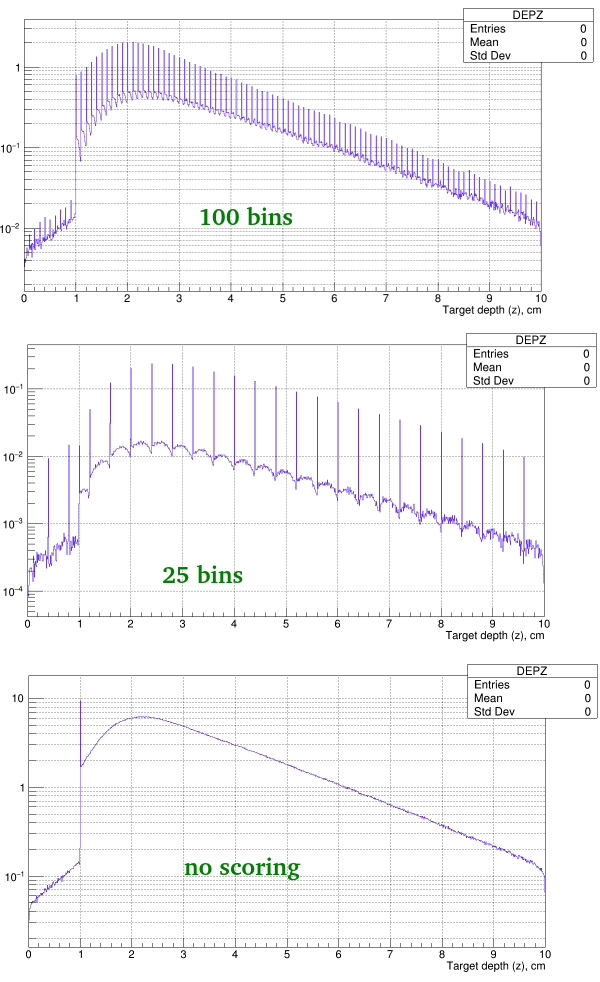
Please, do not take your attention to the peak at 1 cm along horizontal axis. It is the different trouble and I think it caused by connecting two different Logical volumes or may be something else but not by scoring.
So my questions is:
a) why scoring bins affects to sensitive detector data?
b) what is the best method to recording energy deposits along the target: via scoring or sensitive detector?
Sincerely, Alexander