Hi Stewart,
Yup, I am using your vtk viewer. This is useful though the visualisation driver has already proven useful. For instance the above was an export of a visualisation of a scoring mesh from RE03 run4.mac. It didn’t actually export the data as far as I can tell only the colour gradient.
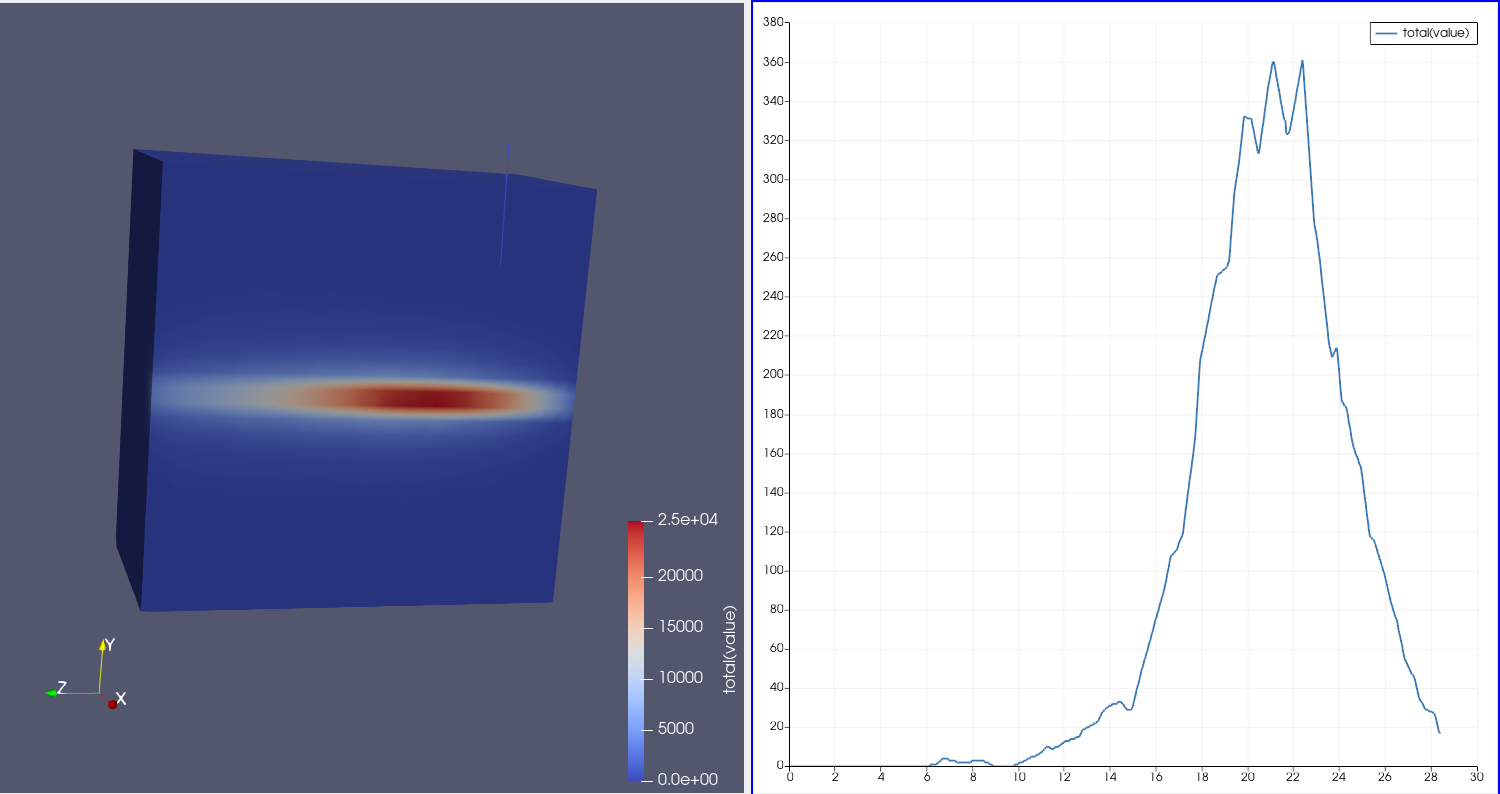
This is a picture of a mesh that I visualised in paraview, with the right hand side being a plot of the intensity across the arbitrary location i chose. Its pretty useful though if I was plotting an effective energy spectrum at that location it would be ideal if we had access to ROOT fit functions. So either ROOT or paraview needs to develop a plugin to have this plot over line feature or import ROOT functions for fitting.
The vtp export can in theory allow you to superimpose this information over the geometry in order to make interpretation more intuitive which is quite useful, though direct access to track information from the vtk export in paraview would be quite nice.
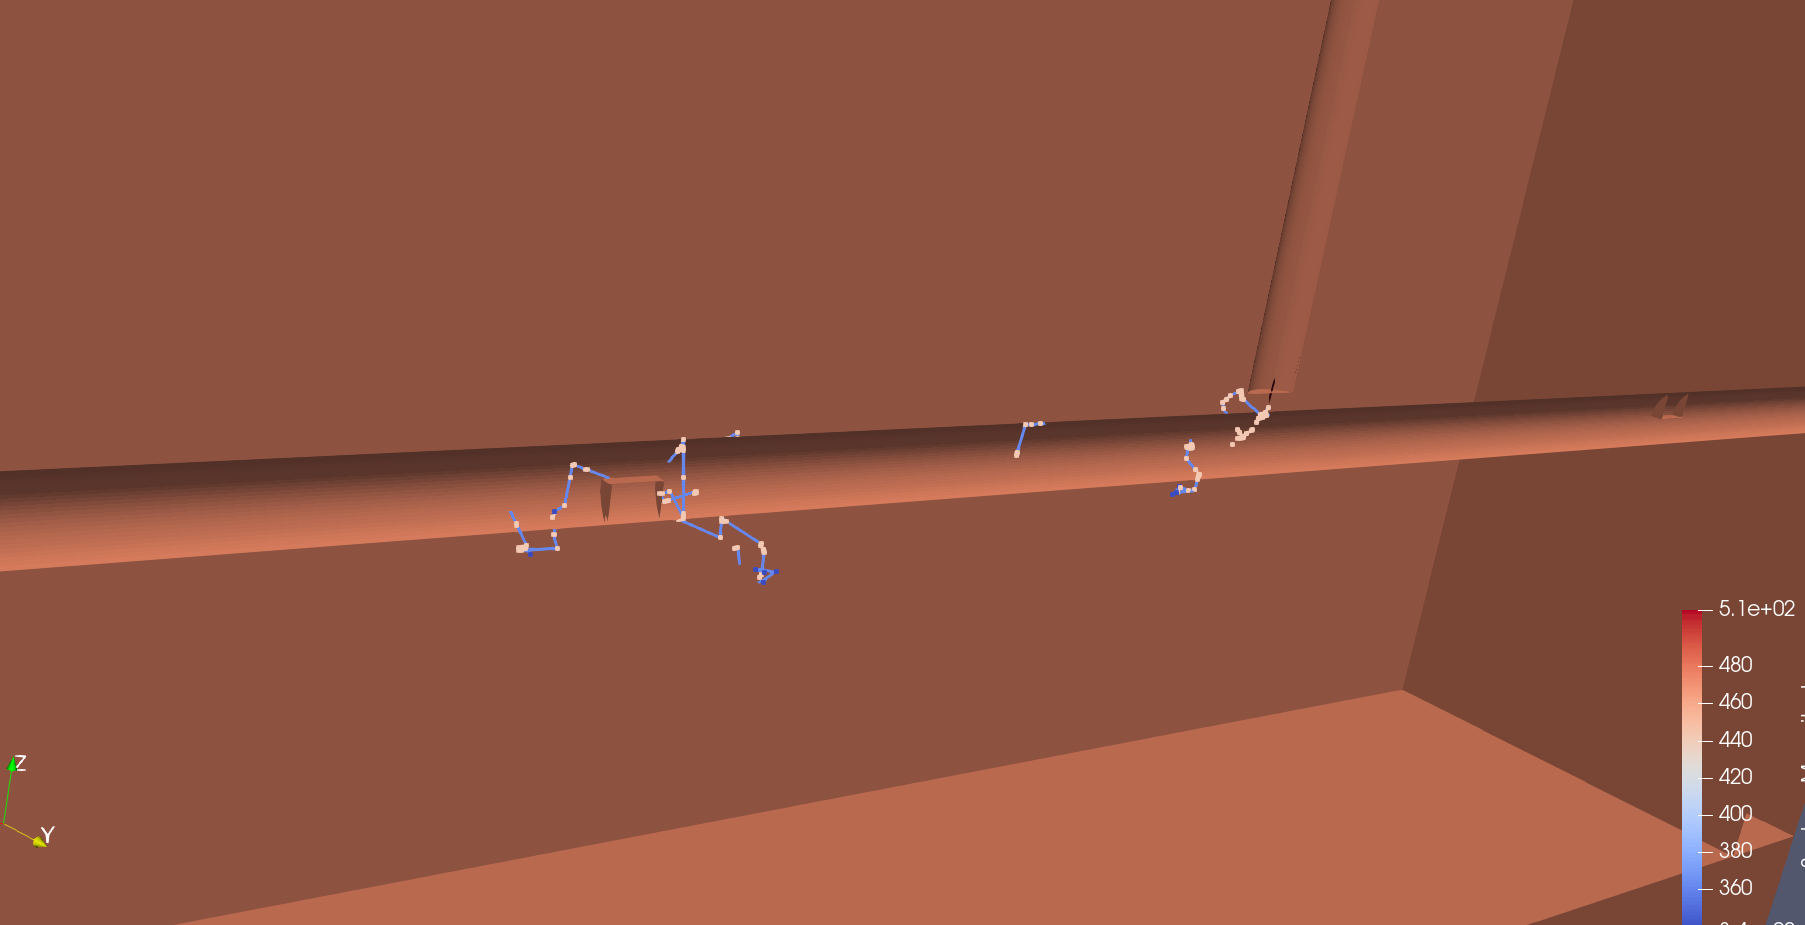
You can see some tracks here, which I suppose you can also see in jsroot. It would be good if they where selectable in order for one to make plots similar to the above mesh. I am not sure if this is possible or if it should be done through a tracking hit collection across the entire geometry. At the moment I think they are artefacts like the intensity plot in my post above.
This project is part of CATS advanced example from Fermi Lab. I haven’t fully looked into it though it may be a good candidate for further integration with the vtk driver in order to export the tracks and other information directly into paraview, though perhaps I misunderstand it.