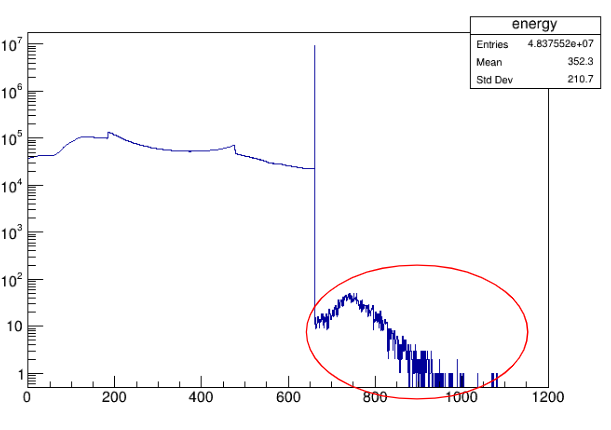
I have simulated 2 * 10^8, Cs-137 ions from cables near Ge-detectors and looked into the energy depositions by Cs-137 into germanium detectors. The spectrum shown below is what I got. Now spectrum looks familiar and there is also a clear peak at 662 keV energy but I am confused about the broad structure(broad peak-like, marked in red) after 662 keV energy. Can anyone explain to me what this structure represents? Or am I doing something wrong and this shouldn’t be present here?
After reviewing your figure, I want to comment that your spectrum looks good. Perhaps you need to add resolution of the detector in your simulations to make your simulation results valid. This can be done in the EventAction.CC or in the post simulations process.
Red part - > Compare the events with the photo-peak, this is considered as background.
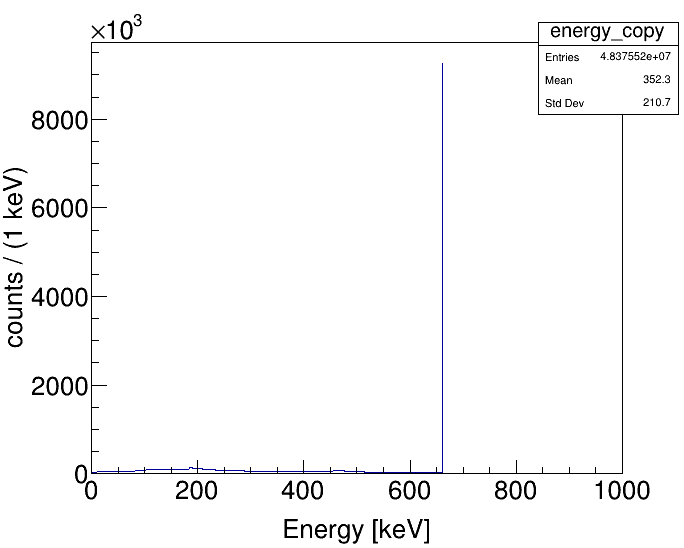
Thanks for the reply. I will add a resolution. But if I changed the figure to a linear scale, then the spectrum is not clearly visible. That’swhy I plotted it in log-scale.
You should first add resolution. As i have no idea about your code therefore, i consider it as background. Also, if you want it on a log scale,
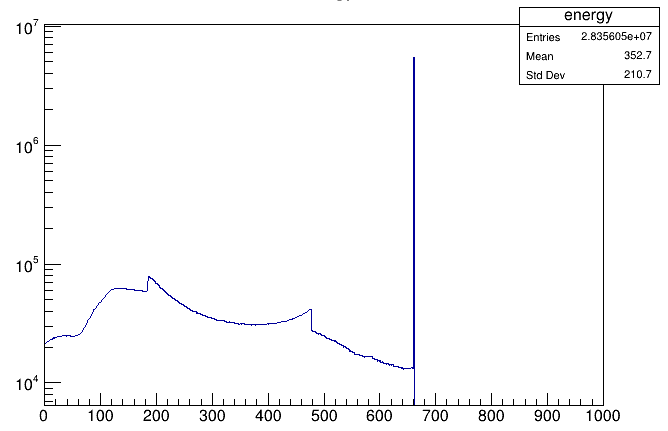
why not scale from 10 to 10^8. Why from 1 or from 0.001.?
Check it.
Without knowing your geometry, it is difficult to say for certain. However, in the decay of Cs137, there are two betas emitted - a 0.5120 MeV endpoint energy beta with 94.6% probability and a 1.174 MeV beta at 5.4% probability. The shape that you’ve circled looks somewhat like a beta spectrum. Its max energy and energy of max intensity are not inconsistent with the high energy beta. So it could be due to the latter one. Of course, energy deposition of the betas is heavily dependent on the geometry.
One test you could do is to replace the Cs-137 source with a source having only the 0.662 MeV gamma ray and see what the spectrum looks like.
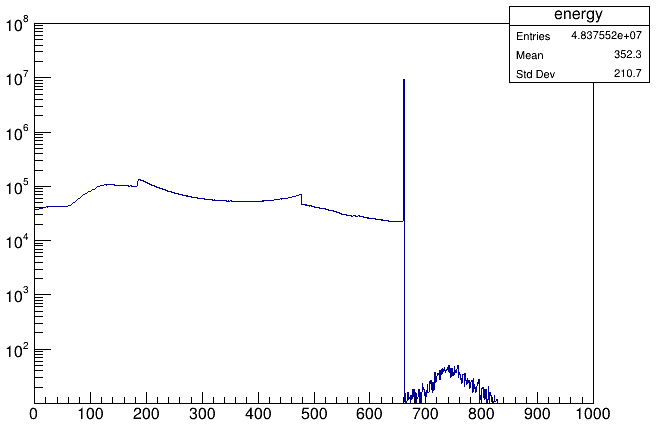
I did simulate only gamma of 0.663 MeV energy. This feature doesn’t appear in that. See the spectrum below:
About geometry: I have an array of 40 Germanium detectors and it has high-voltage and signal cables around it. I am simulating Cs-137 from the cables and see energy depositions in Ge.
Around Ge-detectors is the cryostat containing Liquid argon in it.
This sounds like the physical geometry in your laboratory, isn’t it ? Or geometry description in your simulations. Nevertheless, I believe the problem is resolved.
Alternatively you can write a global particle source macro considering standard 137Cs spectra to cross-check your simulations.
This will be more reliable way.
Thank you. I am going to read this. One question though: Giving the mean and sigma would give resolution to only one gamma peak right? I mean i am simulating whole Cs-137 isotope and if i will implement this G4RandGauss::shoot(eDep,eDep_sigma); for 662 keV gama, it will smear the peak at 662 keV only, right?