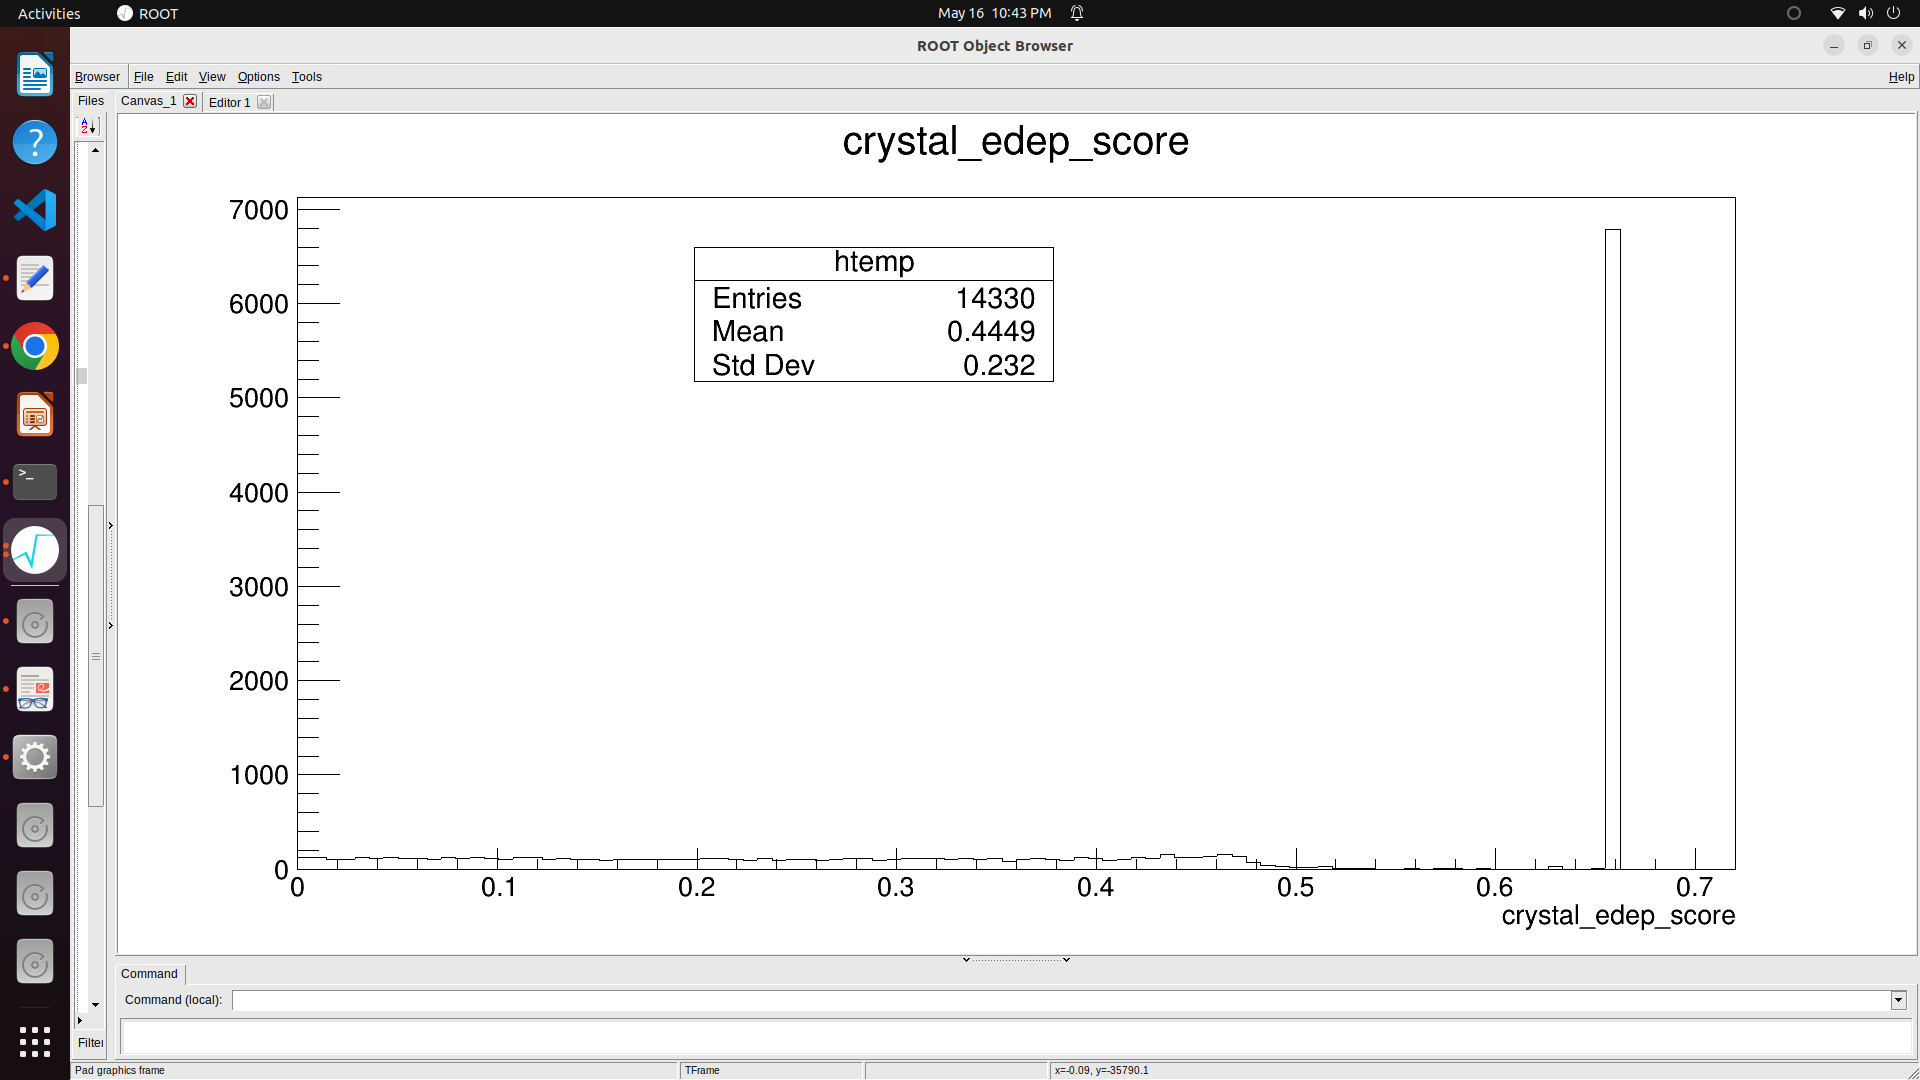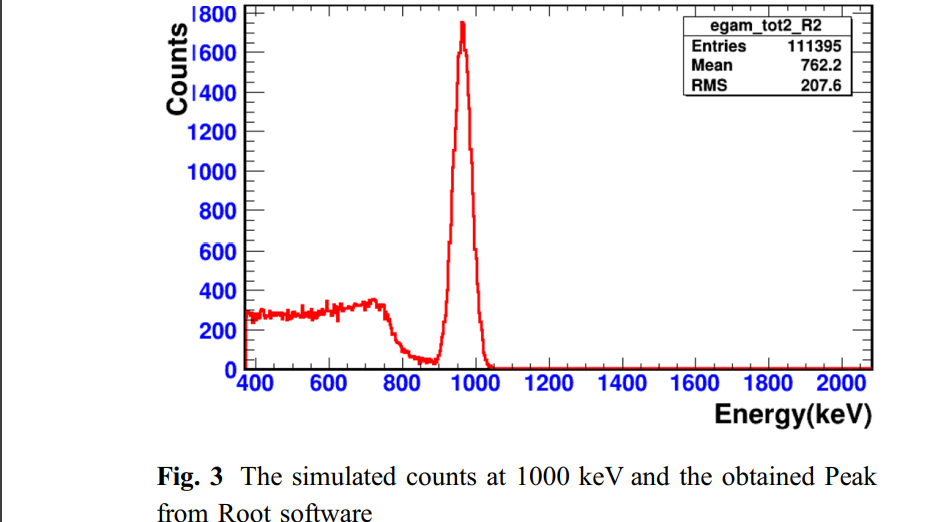
This is really a question for the ROOT forum, though the general idea is to convolve the histogram with the Gaussian that models the energy resolution of your detector as a function of the energy deposited.
1 Like
