I am new to Geant4, trying to write a small program to simulate protons in liquid argon. And I am trying to plot a dedx plot and other properties, code is available here if you like to have a look at.
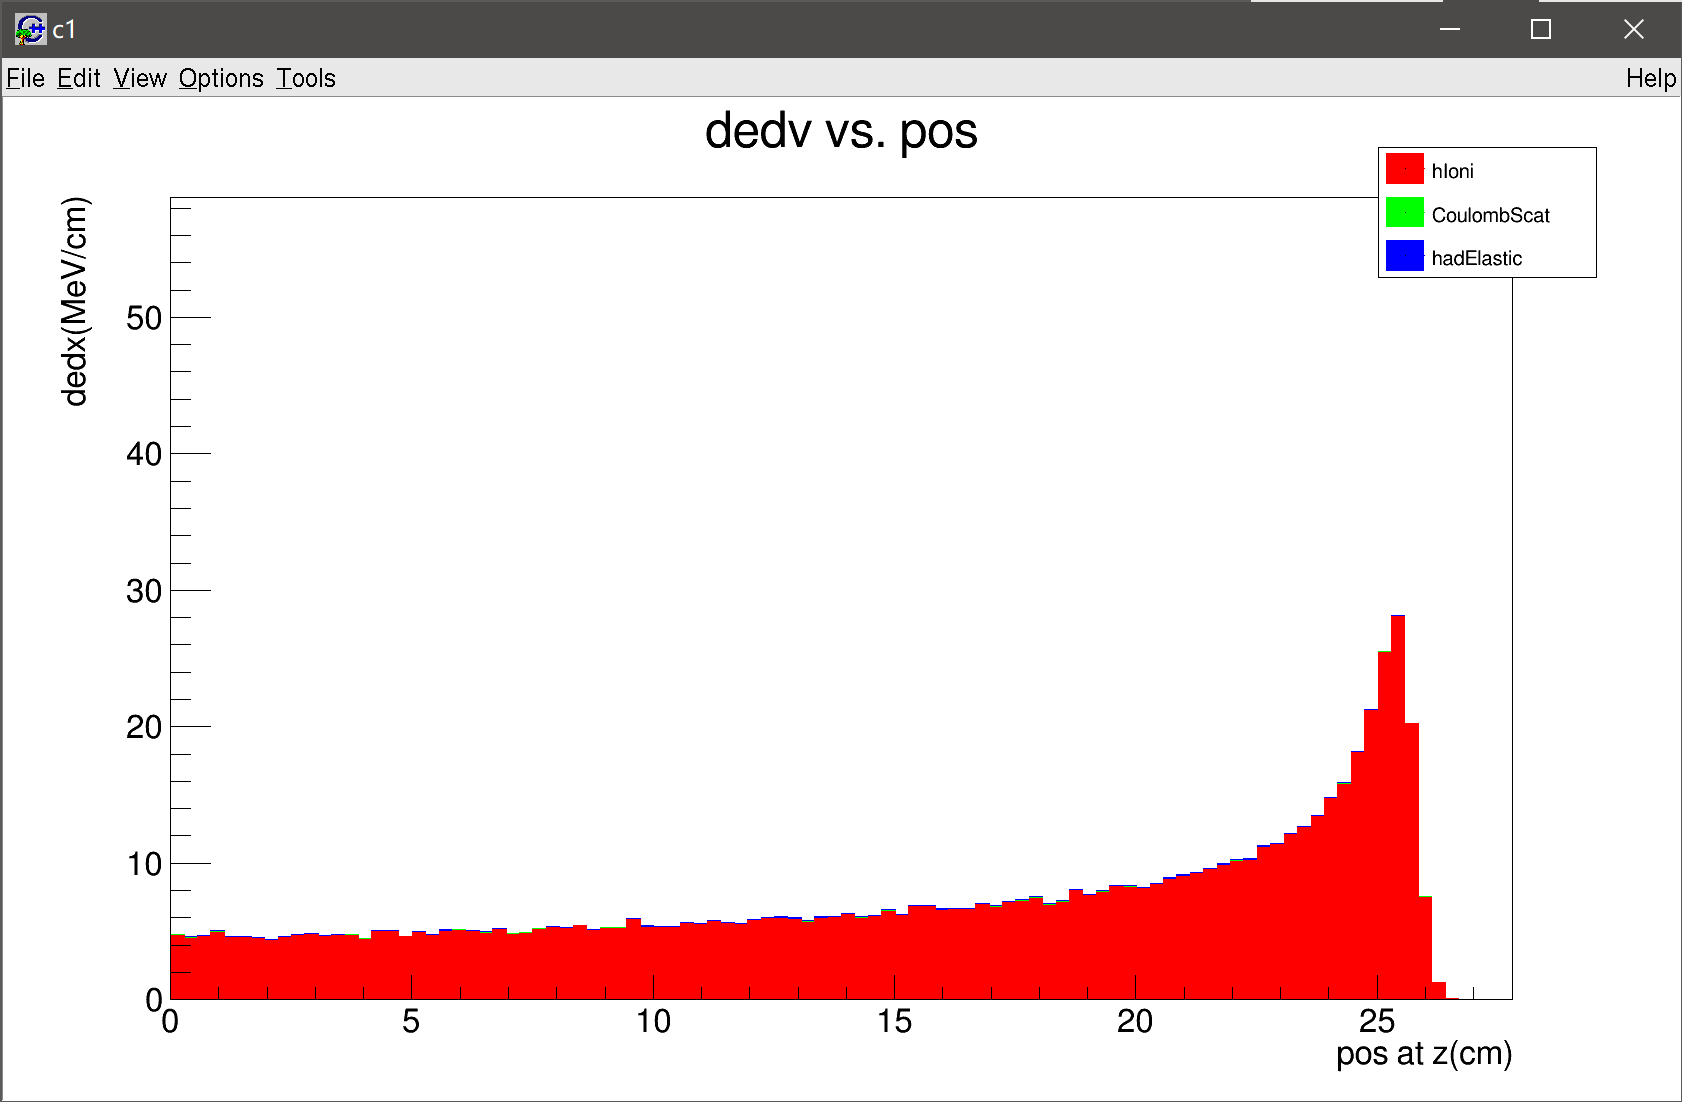
I’d expect a smooth curve with one peak at end(Bragg Peak), while I got:
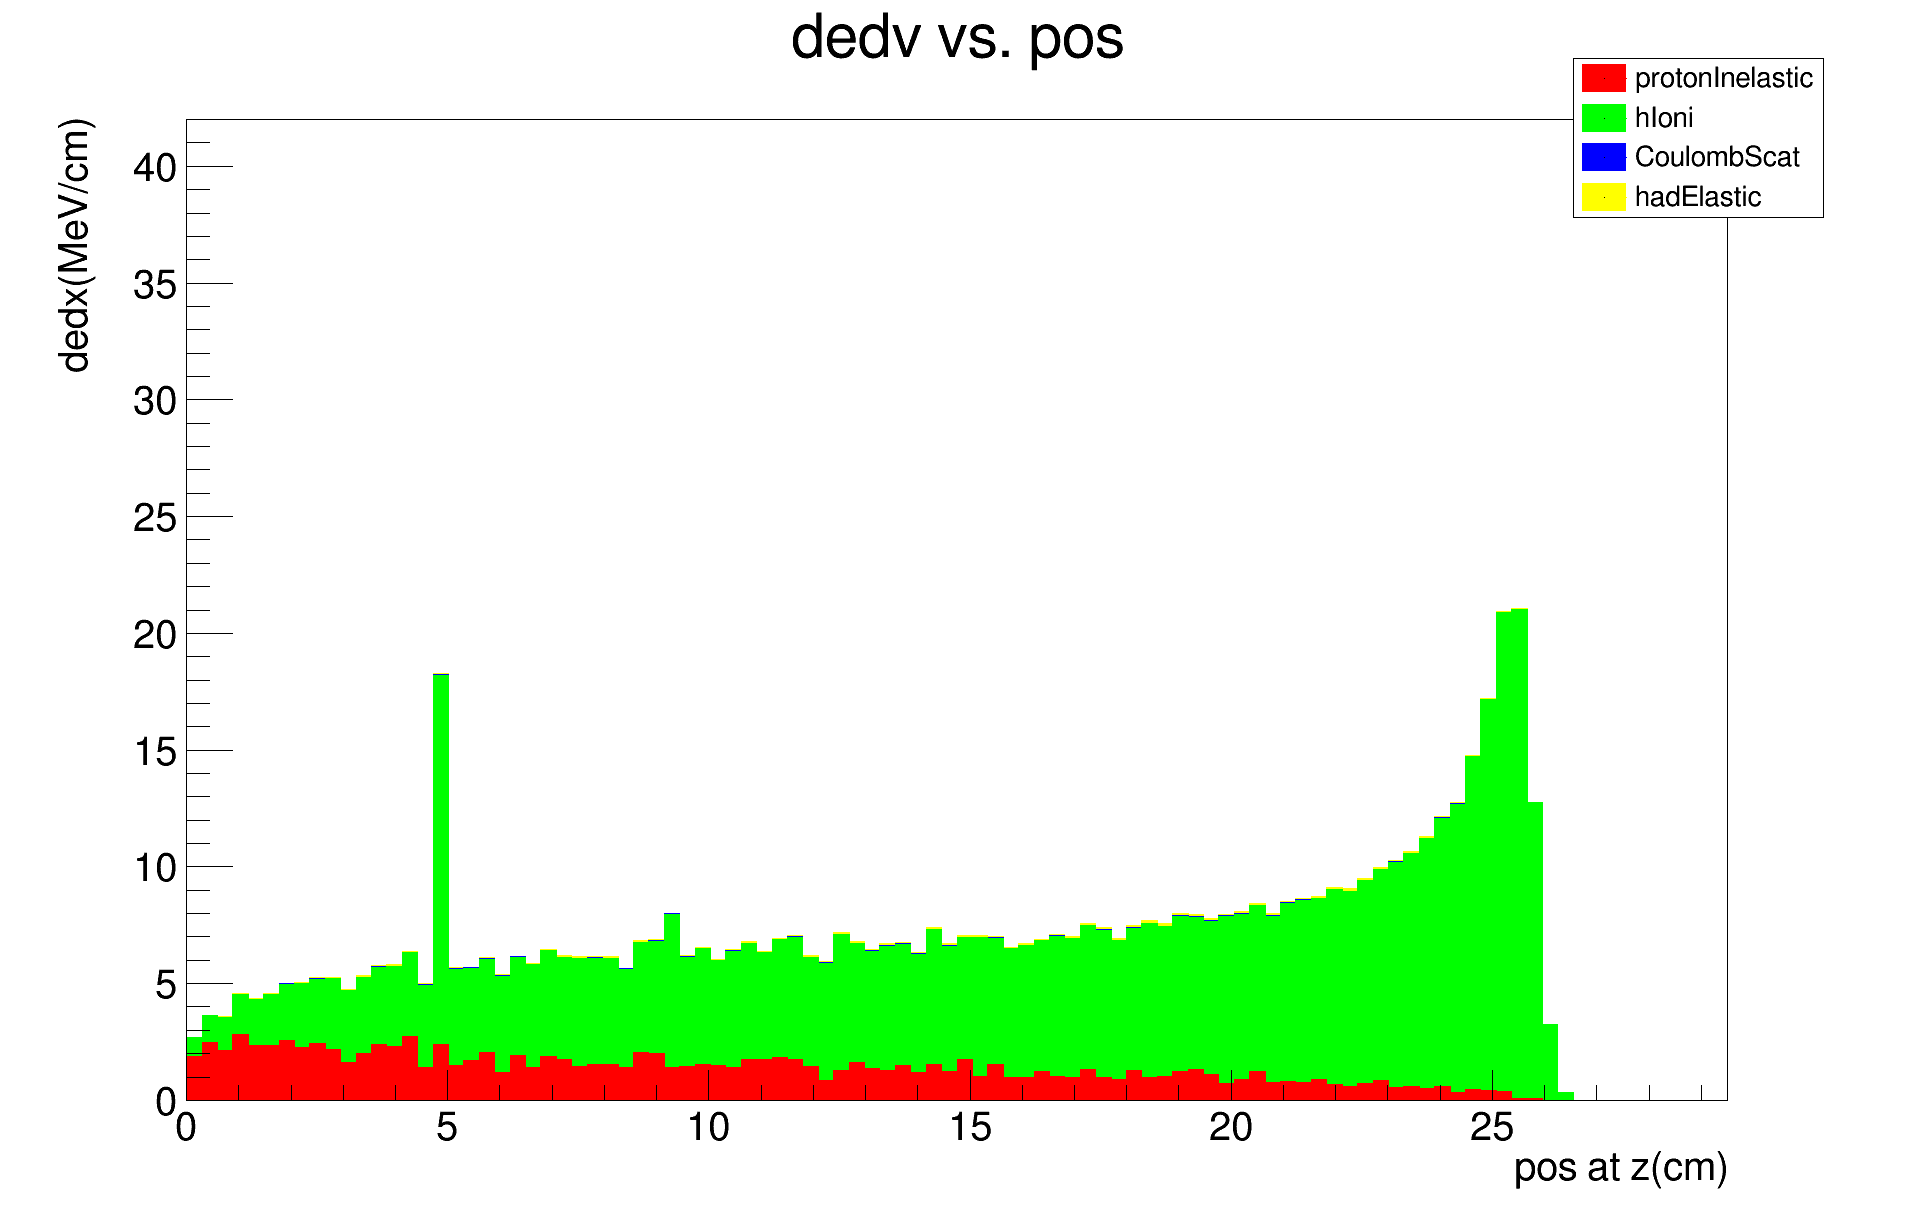
There is a strange peak at near z=5 position, when investing this strange peak, I found my program seem to be more likely to record events at z=5.
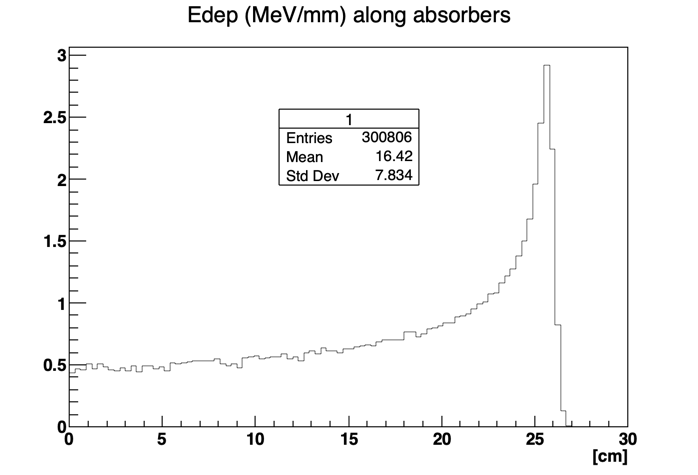
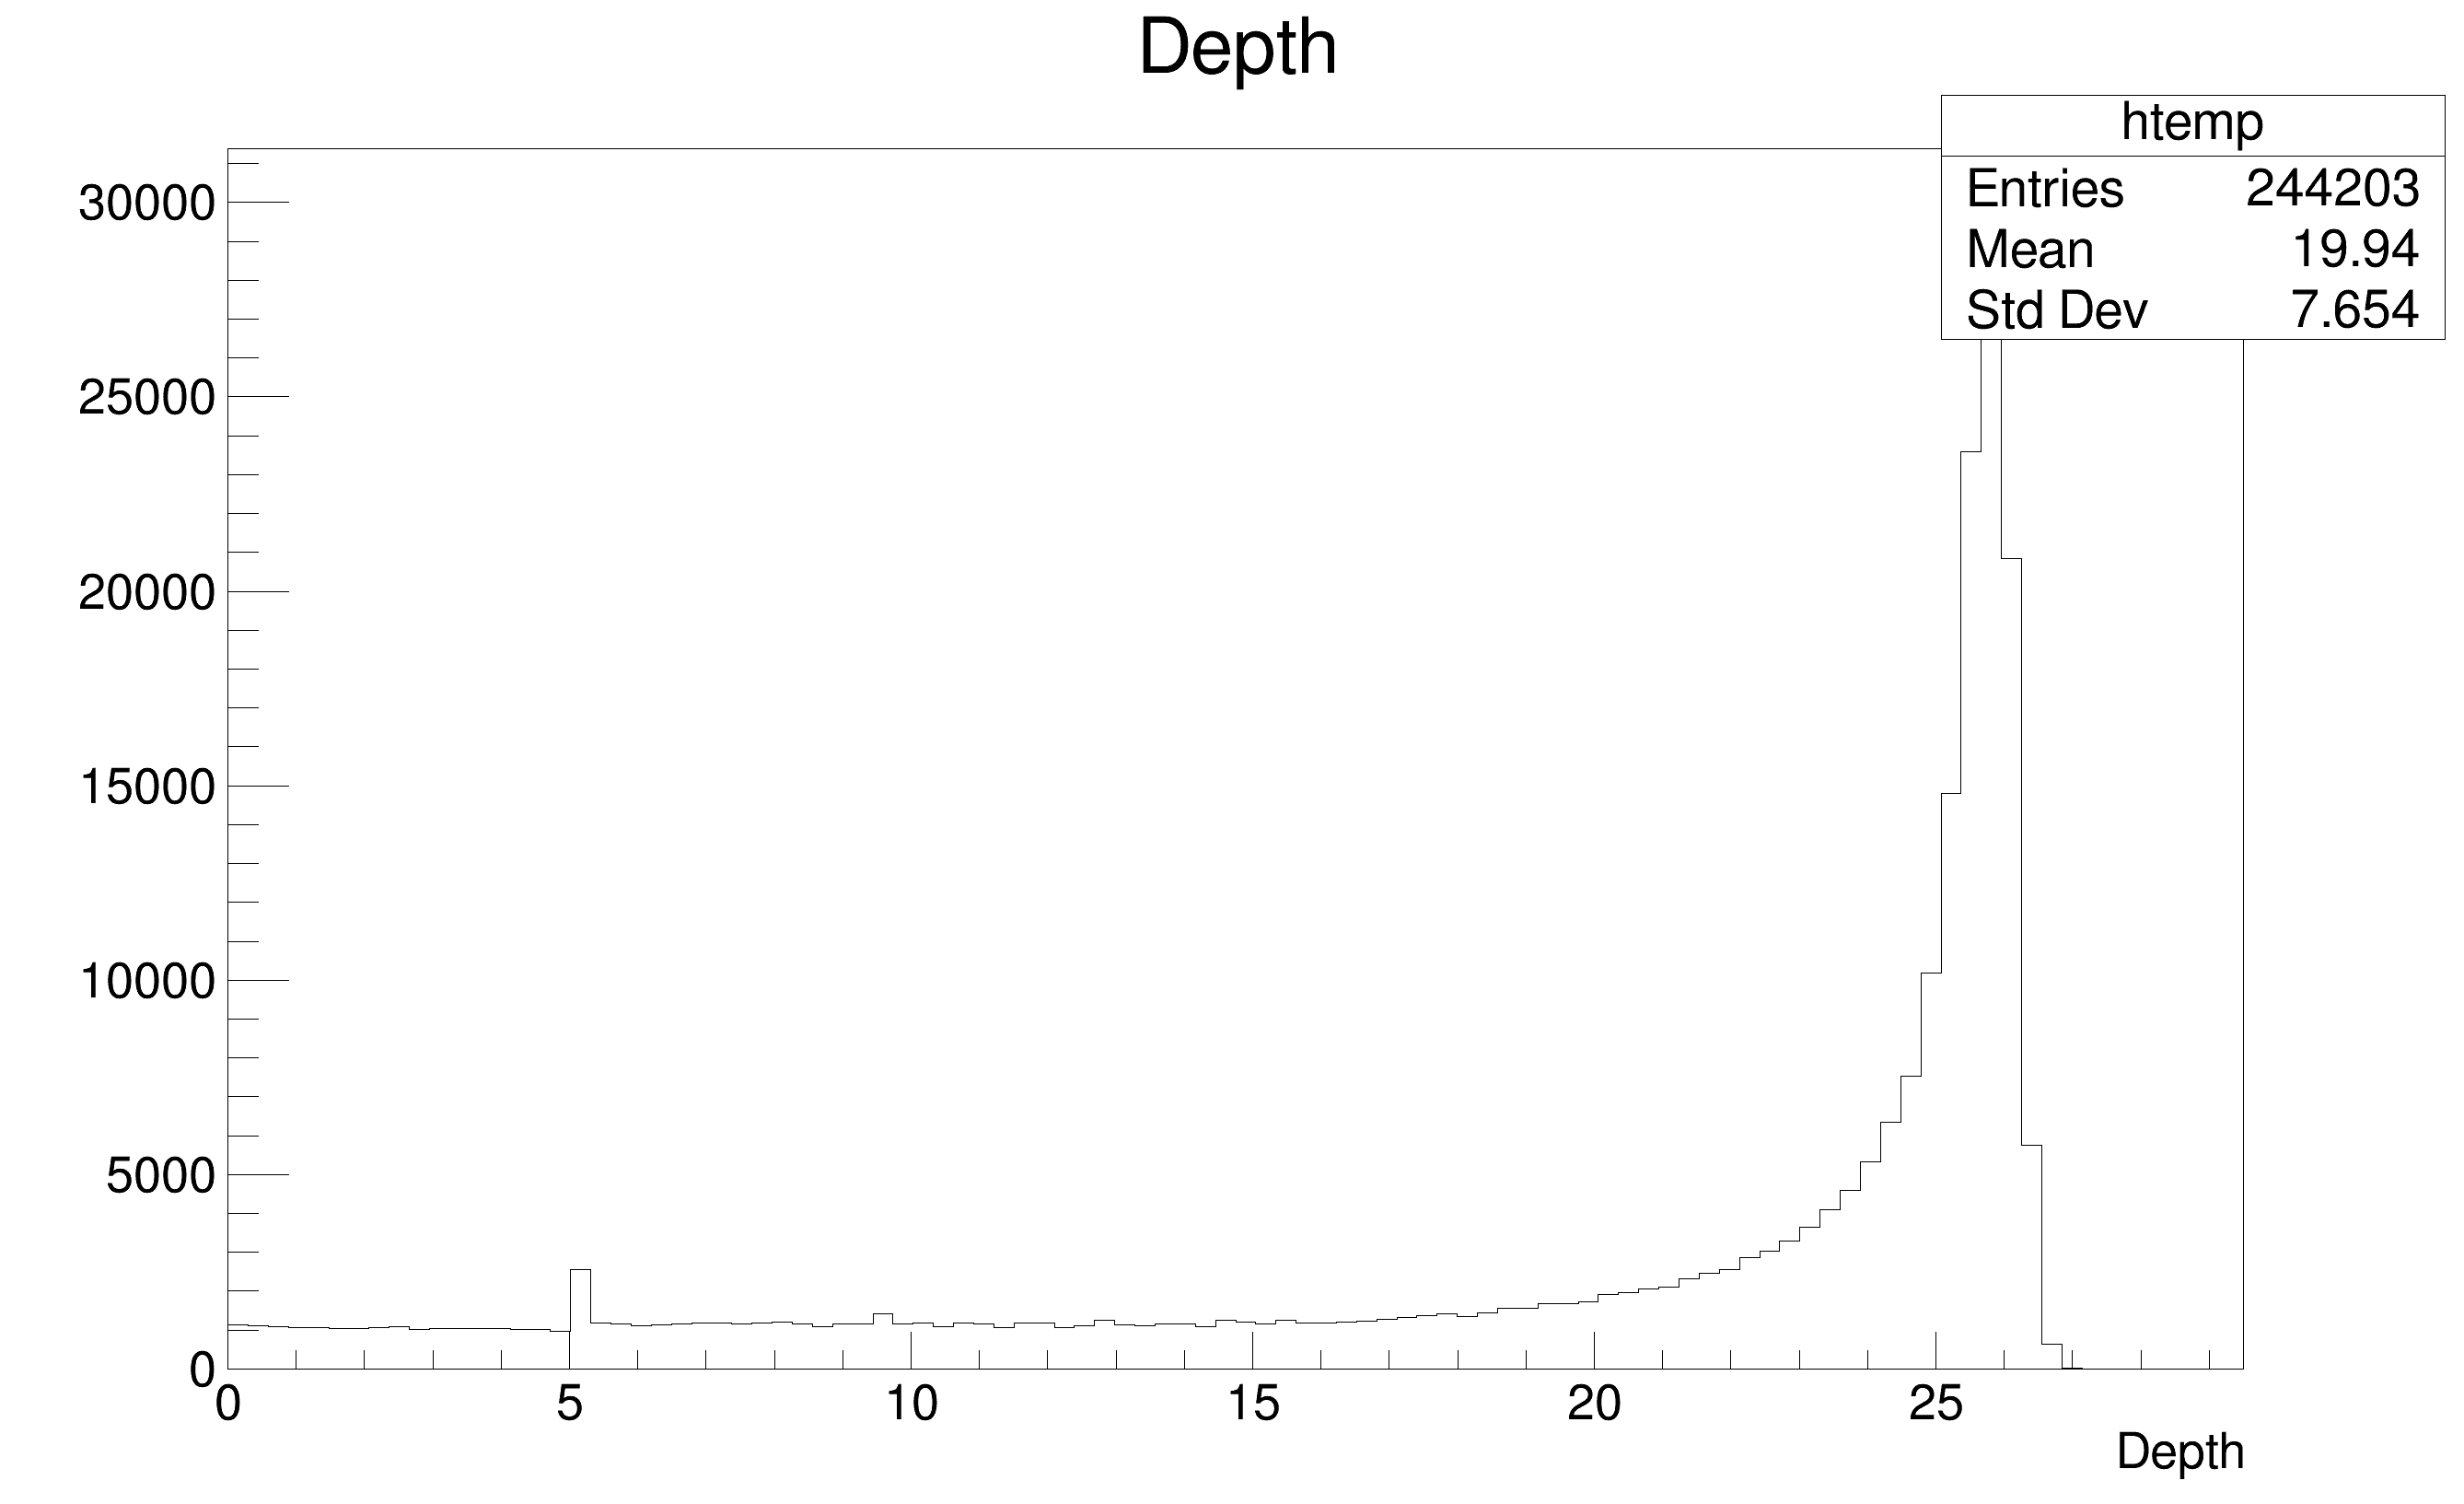
I changed my code to store where the step occurs at UserSteppingAction() and draw a histogram for all stored step->GetPostStepPoint()->GetPosition().z() value.
I get (that is a histogram for z coordinate on each step)
IMAGE HERE
(sorry that I can only put ONE image in a post, this is a link to the histogram)
You can see a peak at near z=5.(and smaller one at z=10)
I don’t expect anything special for that position, but why there is a peak indicating that it is more likely to record events at certain position.
Could anyone help me to figure out my problem, is this from my misunderstanding of Geant4 or that is the mechanism?
PLUS: physics list is QBBC