The last of the 4 numbers after the /gps/ion command corresponds to the energy of the ion. Why do you need to setup non-zero energy? I think if the source is at rest, that number shall be zero, no?
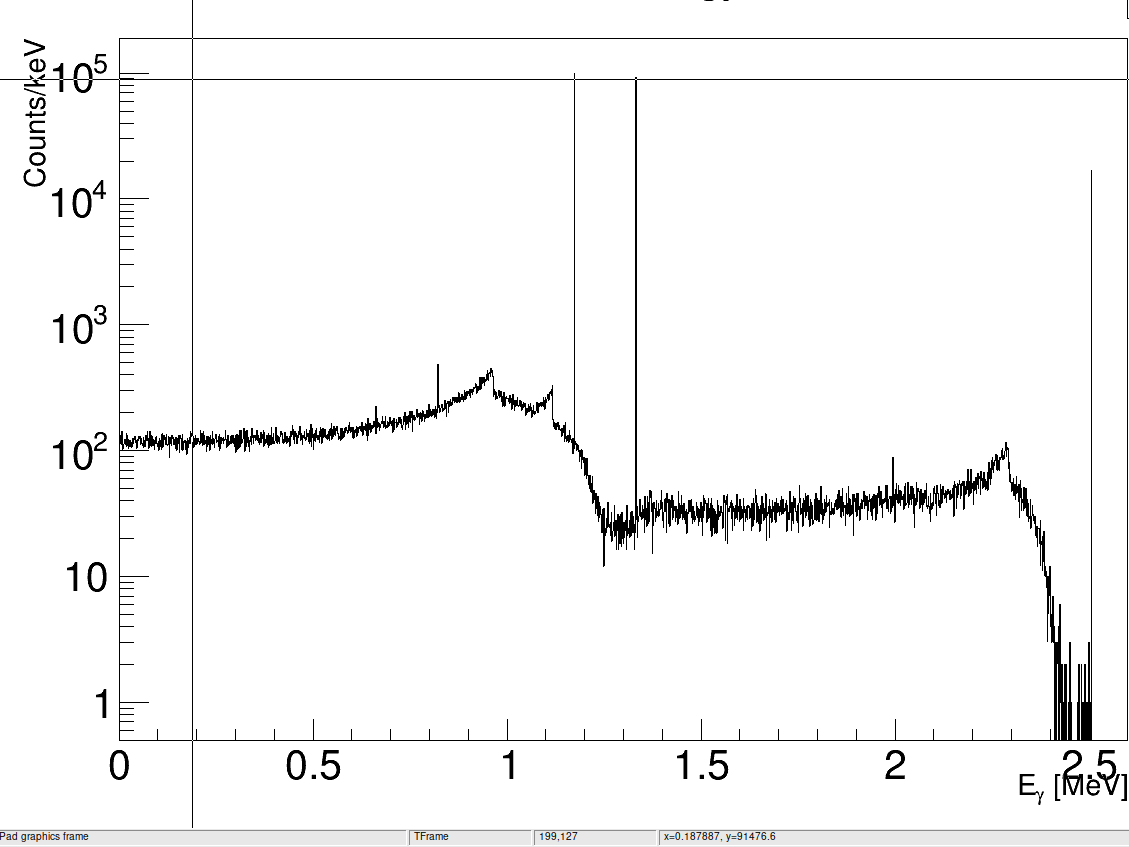
in real life, there is always a non zero probability of having the so-called “summing”, in this case, two gammas (1.2MeV, 1.3 MeV) entering the sensitive volume and leaving all the energy at once (2.5MeV). In real life sometimes it is not possible to separate the components of the summing, in Geant4 simulation you may want to separate them. So, question: does your scoring/SD separate energy deposition from different particles? If the answer is no, I would say the extra peak that you see corresponds to a summing peak. If this is correct, you will see the same effect independently of the decay.
Please, do not mix summing effect (which depends on the physics case and detector efficiency) with the pile-up effect (which is caused by random independent events happening within a very small time window, and therefore it depends only on the rate). Both effects may happen at the same time.
You’ve done it correctly. The fourth argument is the excitation energy. You would specify the kinetic energy separately, which you don’t need to do here (in real life, there would be a small nuclear recoil that gives a Doppler broadening to the gamma lines, but that’s much smaller than your detector resolution).
Your simulation is fine to see the “pure” gamma spectrum, but be aware that electrons can also deliver energy in germanium detectors. So if you plan to compare your simulation to a real, built device, you should go back to letting the Co-60 itself decay.
The ‘strange’ peak is at ~2.25 MeV, not 2.7 MeV. There are actually three such peaks; each one corresponding to a main full energy peak but ~0.2 MeV lower. Their shape on the log plot is very reminiscent of the triangle peaks in HPGe detectors due to inelastic fast neutron scattering in the germanium. Unfortunately, there are no neutrons involved here. So, it’s a little puzzling.
Ya sorry the peak I was referring to was 2.25 (not 2.7) Mev
Actually I am not sure of it’s purely by chance or has something substantial physically but
the Sharp edge of the first two peaks seem to occur roughly (3-4 keV) of the Compton edges for the two gammas of Co60.
Yes, indeed there is no neutron involved as far as I am aware.
I think the sharp high energy edges of those ‘triangles’ are the Compton edges for the respective gammas. They are, as best I can tell with a ruler, at exactly the correct energy for the Compton edge. The shape in between each full energy peak and its Compton edge are just due to dissipative losses from the full energy peak.
I did not follow the discussion in detail. So, I am sorry if this mail is out of game.
With example rdecay01, I noticed a somewhat different energy spectrum if we start with an excitation energy of 2505.753 keV (red) or 2505.8 keV (blue)
I remember this, Michel, with other elements! The nuclear excited states, with particular decays, are tabulated for a specific energy value. If you set the excitation to exactly what is in the table, then G4 will do the decays to the tabulated states.
But if you “round off” (like 2505.8 instead of 2505.753, in this example), then G4 will do a “generic” de-excitation. I think it tries to throw off a gammas to get to one of the known states, but it can also throw off the whole excitation energy at once, or jump to some lower state than you intended, etc. Hence the blue vs. red differences that Michel has shown.
Thank You Mike for clarifying this, it really explains it nice
I see ! so does this mean that the 2.5 Mev peak that I am getting is overestimated as compared to real scenario and has two contributions
1.) True coincidence due to the two (1.17 and 1.33) gammas being depositing their energies simultaneously.
2.) Direct energy transition from whole excitation energies as you pointed out?
That makes sense. The red spectrum (using the exact excited level energy) agrees with the 60Ni decay scheme following 60Co beta decay. The true decay scheme also has two weak lines at 2.5057 MeV (intensity 0.00005) and 0.3469 MeV (intensity 0.008) that are too weak to be seen in the red spectrum. The blue spectrum seems to be out to lunch.
The 2.5 MeV peak is due to either a single gamma ray from the deexcitation of the 2.50573 MeV level (probability ~ 0.00001) or the deposit of energy from 1.33250 MeV and 1.17321 MeV gammas from the cascade dexcitation of that level (probability 1). For the latter, the cascade time scale is effectively instantaneous, that is, too short for the detector to tell the difference between two gammas with summed energy or a single of the same energy. So both are effectively normal full energy peaks. There may be ways using sophisticated electronics to distinguish the two effects, but the simulation doesn’t include it.