Strange Results for The Radioactive Decay of Tb160 isotope

Hi Everyone,

I am new to Geant and I am trying to simulate the decay of a single Tb160 isotope in air surrounded by lead, in order to produce a gamma ray energy spectrum. I have used the example radioactive decay and example B3 as a template to do this. I used the following macro commands to score, mesh and plot a histogram (using python).

/score/create/boxMesh box11
/score/mesh/boxSize 15. 15. 15. cm
/score/mesh/nBin 30 30 30

/score/quantity/energyDeposit eDep
/score/filter/particle gammaFilter gamma
/score/close

/run/beamOn 20000000
/score/dumpQuantityToFile box11 eDep box31.csv

However, I get the following histogram when I plot the results.

The plot looks very strange for a number of reasons;
-The very large peak at low energies (E<0.1 MeV)
-The very high energy deposition at higher energies (E>1 MeV) which is not at all typical for the gamma spectrum produced due to the decay of Tb160

I have been stuck on this problem for quite some time, so any help would be greatly appreciated.

I have noticed that I placed the scoring manager at the incorrect position in the main (From manual: the method G4ScoringManager::GetScoringManager() must be invoked right after the instantiation
of G4RunManager) and got the following results.

This seems to make a lot more sense as the peaks line up very well to what is expected.
However, when I expand the Energy (x) axis I get the following result.

When looking at the csv file that generated the graph I noticed there is a column for “entries”. I could not find an explanation about this in the manual, but I can only assume that the energy deposits are being summed because an increase in entries results in an increased energy deposited within a bin.
Is this observation correct?
And if so, would increasing the binning (x,y,z) reduce the increased number of entries within each bin and hence reduce the abnormally large (E>3MeV) energies observed?

Thanks,
Jason.

I’ve moved this to the Physics forum as it seems better suited here and be seen by the relevant experts!

I guess you have already done, but in case … Here, the gamma spectrum given by rdecay01.
Tb160.mac.txt (221 Bytes)

Hi Maire,

Thank you for your reply.

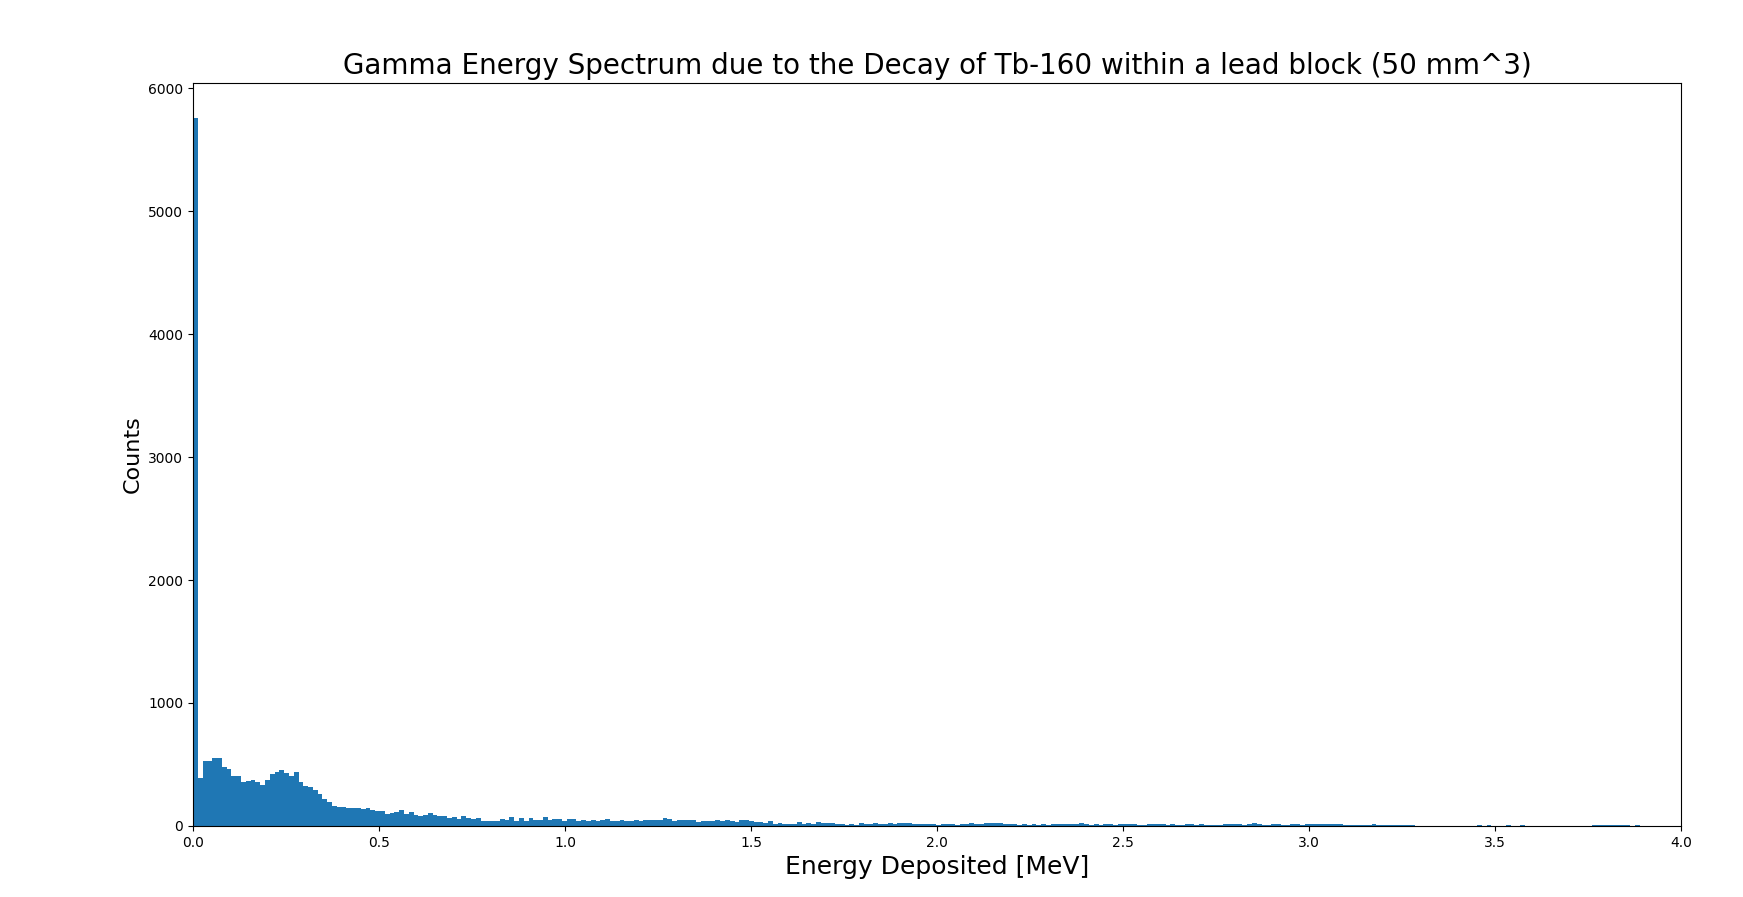
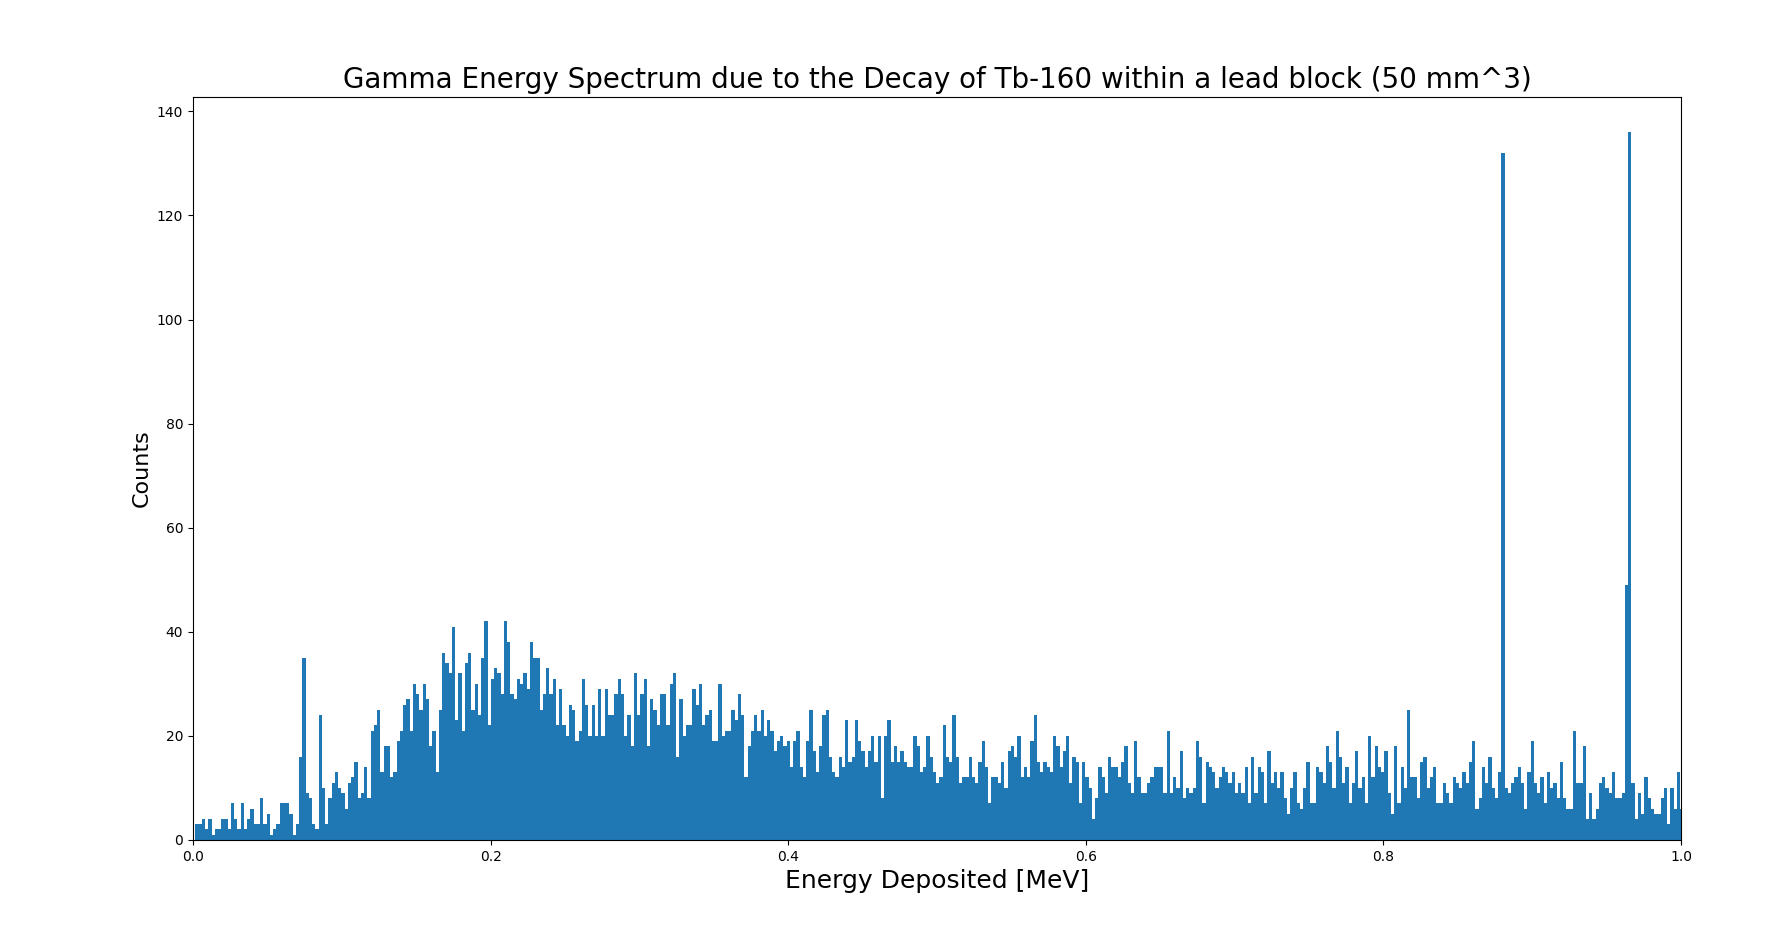
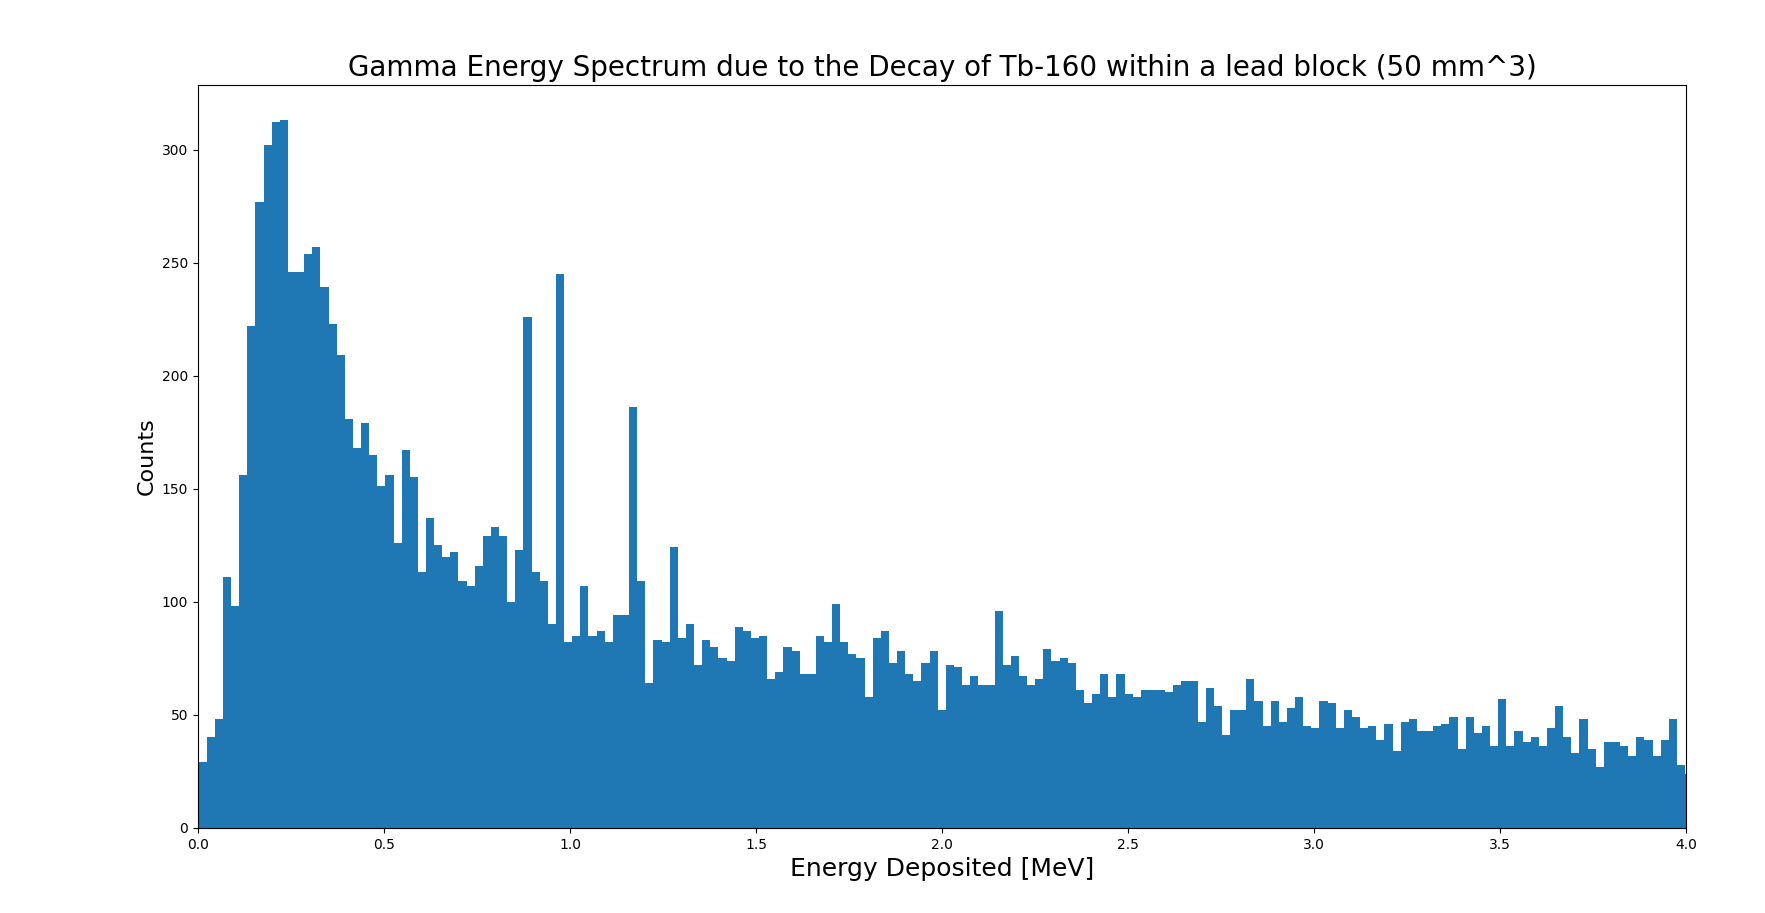
I ran the macro file and got the following;

#class tools::histo::h1d
#title energy spectrum (%): gamma
#dimension 1
#axis fixed 160 0 1600
#annotation axis_x.title [keV]
#bin_number 162
entries,Sw,Sw2,Sxw0,Sx2w0
0,0,0,0,0
34446,34.446,0.034446,147.041,864.552
95105,95.105,0.095105,1124.52,13478
33,0.033,3.3e-05,0.813439,20.2636
21,0.021,2.1e-05,0.719122,24.8384
17483,17.483,0.017483,800.478,36653.4
4324,4.324,0.004324,226.921,11910.5
1,0.001,1e-06,0.0615839,3.79258
92056,92.056,0.092056,6850.97,509967
38498,38.498,0.038498,3313.23,285189
100,0.1,0.0001,9.67735,937.36
1125,1.125,0.001125,119.182,12632.3
1157,1.157,0.001157,132.867,15267.5
1080,1.08,0.00108,134.798,16834
989,0.989,0.000989,133.304,17975.7
882,0.882,0.000882,127.914,18558.3
734,0.734,0.000734,113.712,17622.6
654,0.654,0.000654,107.764,17762.4
572,0.572,0.000572,100.058,17507.6
485,0.485,0.000485,89.705,16596
5717,5.717,0.005717,1125.52,221591
399,0.399,0.000399,81.8354,16787.9
4349,4.349,0.004349,937.539,202114
333,0.333,0.000333,74.8581,16830.7
405,0.405,0.000405,94.7233,22158.3
308,0.308,0.000308,75.3952,18458.2
291,0.291,0.000291,74.0844,18863
220,0.22,0.00022,58.2797,15440.7
243,0.243,0.000243,66.7908,18360.1
184,0.184,0.000184,52.4407,14947.4
26296,26.296,0.026296,7850.68,2.34383e+06
1022,1.022,0.001022,315.638,97487
144,0.144,0.000144,45.2969,14249.8
139,0.139,0.000139,45.1152,14644.1
394,0.394,0.000394,132.722,44709.3
113,0.113,0.000113,39.0186,13474.2
97,0.097,9.7e-05,34.4315,12222.6
101,0.101,0.000101,36.8614,13454.1
100,0.1,0.0001,37.5472,14098.8
96,0.096,9.6e-05,36.9775,14243.9
1413,1.413,0.001413,554.827,217859
75,0.075,7.5e-05,30.411,12331.7
79,0.079,7.9e-05,32.7866,13607.6
63,0.063,6.3e-05,26.7704,11376
65,0.065,6.5e-05,28.2324,12263.1
57,0.057,5.7e-05,25.3558,11279.7
47,0.047,4.7e-05,21.3742,9720.72
45,0.045,4.5e-05,20.9401,9744.64
47,0.047,4.7e-05,22.3095,10589.9
108,0.108,0.000108,52.4322,25455.3
41,0.041,4.1e-05,20.295,10046.3
30,0.03,3e-05,15.1558,7656.84
372,0.372,0.000372,190.28,97330
32,0.032,3.2e-05,16.8029,8823.29
31,0.031,3.1e-05,16.588,8876.43
25,0.025,2.5e-05,13.629,7430.23
29,0.029,2.9e-05,16.0978,8936.07
29,0.029,2.9e-05,16.3858,9258.57
23,0.023,2.3e-05,13.234,7614.94
23,0.023,2.3e-05,13.4603,7877.54
25,0.025,2.5e-05,14.8498,8820.79
20,0.02,2e-05,12.1017,7322.73
12,0.012,1.2e-05,7.38099,4540.01
12,0.012,1.2e-05,7.51851,4710.75
15,0.015,1.5e-05,9.49241,6007.11
13,0.013,1.3e-05,8.38604,5409.79
9,0.009,9e-06,5.88916,3853.65
11,0.011,1.1e-05,7.3127,4861.53
10,0.01,1e-05,6.74821,4553.91
615,0.615,0.000615,419.644,286343
4,0.004,4e-06,2.77917,1930.96
17,0.017,1.7e-05,12.0148,8491.61
6,0.006,6e-06,4.29721,3077.72
5,0.005,5e-06,3.63003,2635.45
5,0.005,5e-06,3.66977,2693.45
6,0.006,6e-06,4.46822,3327.57
4,0.004,4e-06,3.00946,2264.22
2134,2.134,0.002134,1633.11,1.24978e+06
4,0.004,4e-06,3.10962,2417.47
6,0.006,6e-06,4.7045,3688.77
2,0.002,2e-06,1.58842,1261.58
5,0.005,5e-06,4.03221,3251.77
5,0.005,5e-06,4.06479,3304.52
4,0.004,4e-06,3.29897,2720.83
7,0.007,7e-06,5.84056,4873.25
0,0,0,0,0
3,0.003,3e-06,2.56514,2193.32
4,0.004,4e-06,3.45977,2992.51
30151,30.151,0.030151,26512.5,2.33131e+07
1,0.001,1e-06,0.882624,779.025
0,0,0,0,0
0,0,0,0,0
0,0,0,0,0
2,0.002,2e-06,1.84317,1698.64
0,0,0,0,0
0,0,0,0,0
0,0,0,0,0
34766,34.766,0.034766,33552.3,3.23811e+07
1,0.001,1e-06,0.973374,947.457
0,0,0,0,0
0,0,0,0,0
1234,1.234,0.001234,1237.67,1.24134e+06
0,0,0,0,0
0,0,0,0,0
0,0,0,0,0
0,0,0,0,0
0,0,0,0,0
104,0.104,0.000104,111.181,118858
0,0,0,0,0
0,0,0,0,0
0,0,0,0,0
466,0.466,0.000466,513.826,566561
1649,1.649,0.001649,1838.86,2.05058e+06
1,0.001,1e-06,1.12208,1259.07
0,0,0,0,0
0,0,0,0,0
0,0,0,0,0
1,0.001,1e-06,1.16821,1364.71
14776,14.776,0.014776,17405.5,2.05028e+07
0,0,0,0,0
2656,2.656,0.002656,3186.91,3.82395e+06
0,0,0,0,0
0,0,0,0,0
0,0,0,0,0
0,0,0,0,0
0,0,0,0,0
80,0.08,8e-05,100.106,125264
0,0,0,0,0
7153,7.153,0.007153,9097.73,1.15712e+07
99,0.099,9.9e-05,127.274,163623
8,0.008,8e-06,10.3973,13513
0,0,0,0,0
2827,2.827,0.002827,3709.51,4.8675e+06
0,0,0,0,0
0,0,0,0,0
0,0,0,0,0
0,0,0,0,0
0,0,0,0,0
0,0,0,0,0
0,0,0,0,0
0,0,0,0,0
0,0,0,0,0
0,0,0,0,0
0,0,0,0,0
0,0,0,0,0
0,0,0,0,0
0,0,0,0,0
0,0,0,0,0
0,0,0,0,0
0,0,0,0,0
0,0,0,0,0
0,0,0,0,0
0,0,0,0,0
0,0,0,0,0
0,0,0,0,0
0,0,0,0,0
1,0.001,1e-06,1.55658,2422.95
0,0,0,0,0
0,0,0,0,0
0,0,0,0,0
0,0,0,0,0
0,0,0,0,0
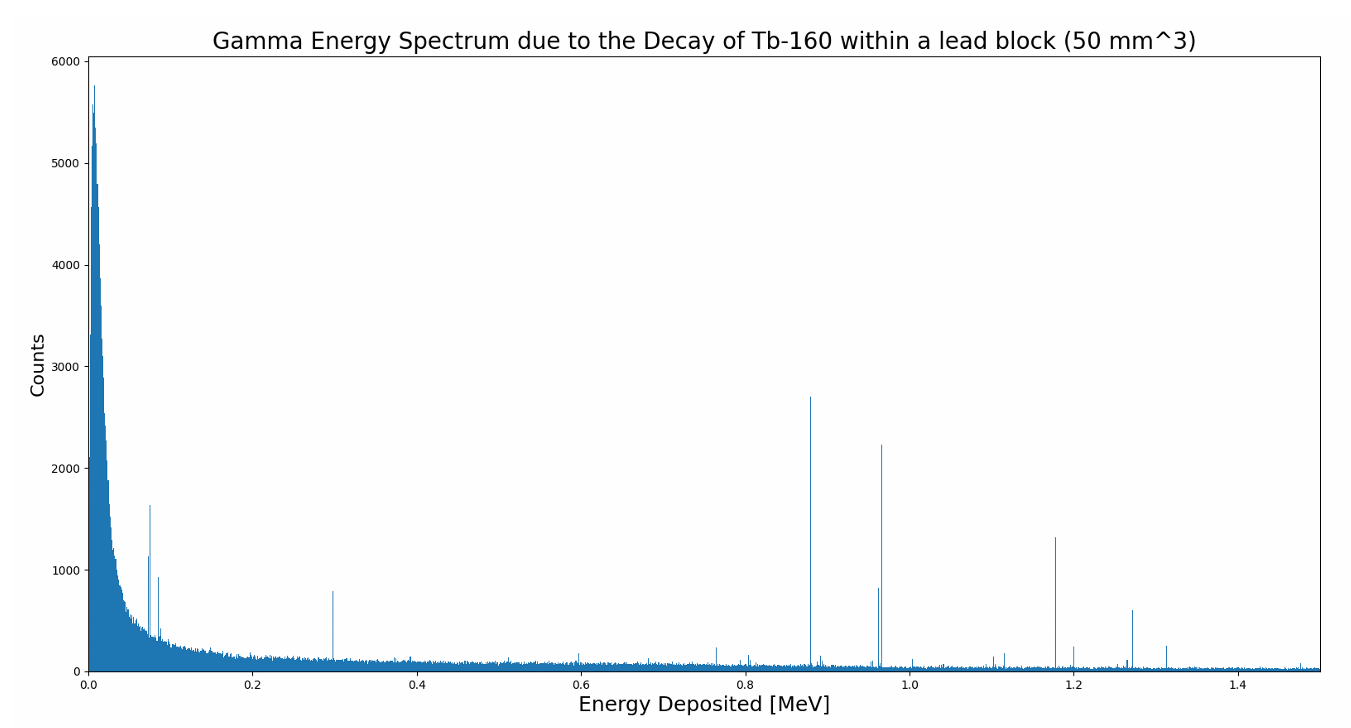
I can see you are using root to create these plots however, I dont have access to root, therefore I am using python to create the plots.

I know that Sw indicates the sum of weights, Sw2 the sum of weights squared, Sxw0 the sum of weights times bin number and finally Sx2w0 the sum of weights times bin number squared. Can you tell me how you were able to plot this spectrum using the above information? Am I right in saying that the weight corresponds to the absorbed energy of a particle in a sensitive detector?

Kind Regards,
Jason.

I am not familiar with cvs files.
Even if you do not have Root, keep root format or choose xml. Add the command : /analysis/h1/setAscii 3 (see attached macro). You will get an ascii file : Tb160.ascii
I do not know if this file can be digested by python but, at least, it is well readable.
column 1 is bin number
column 2 is gamma energy at creation, in keV. More exactly middle value of the bin
column 3 is number of gamma per bin. More exactly ratio = 100*nbGamma/nbEvents

Tb160.mac.txt (245 Bytes)
Tb160.ascii.txt (5.0 KB)

That’s great, thanks a lot for your help!

Hi Marie, I just have one final question.
I am scoring the energy deposited within lead surrounding the Tb160 isotope.
Most of the peaks seem to match up well, but I am getting a very high energy deposit at low energies which is quite strange.
I have been running 1 million events for each simulation with a lead material of 1 mm in one simulation and the second is 10 cm to compare.
The energy seems to go down when I decrease the thickness of the lead.

Tb160_1 mm.ascii.txt (5.0 KB)
Tb160_10cm.ascii.txt (5.0 KB)

Thanks again for your help,
Jason.

I do not know your application. Where and how do you fill the histogram ?

In my TrackingAction I have the following;
tracking_action

And in my EventAction;

you fill histogram 3 twice, with 2 different things.

  • Ekin is the gamma energy at creation
    -fEvisTot is the total ‘visible’ energy released in the decay chain : gamma + e- + alpha + nuclei, but not neutrinos.

rdecay01 shows the true decay chain, independent of the material or its thickness.

Hi Maire, thank you for your reply.
I have changed the ID from 3 -> 9 for fEvistot in EventAction. This had no affect on the results.
I also removed anything referring to fEvisTot to ensure it wasn’t included in the histogram and this also had no affect on the results.

Hi Michel,

I managed to solve the issue I was previously having and the spectrum appears to shows accurate photopeaks. However, I would also like to include the Compton background in the gamma spectrum histogram. Do you know if this is possible to do this using the built in histograms in rdecay01 or does it just produce the photopeaks?

I have also plotted the gamma spectrum using the UI commands (defined binning, primitive scorer, and dumping the scored data to a txt file) to get the following results.

The large lower energy peak appear to be x-rays due to the lead and Tb160.

Thanks,
Jason.

rdecay01 is a special, and very limited example. The physics list (see rdecay01/src/PhysicsList.cc) includes only G4Transportation and G4RadioactiveDecay. No EM physics, no other hadronic physics, nothing. You won’t get any detector interactions of any kind.

If you want to see realistic detector response to decays, use rdecay02.

Hello @maire, I found your reply. Is it possible:

  1. Just write bin number and counts (ie without mean energy) but also write the branching ratio of the radionuclide decay

  2. Choosing how to write the numbers (I mean, by default it writes scientific notation with many decimals)…
    ?

Thank you

I have also used the B3 example as a template for radioactivity experiments with I-125, if you find the test results problematic please ask if you have considered the physical list. I have used my own physics list which contains radioactivity to give decay and some other physical processes, but the experimental data is a bit small. Later I used QGSP_BERT_HP physics list and the situation was better. Can you tell me what kind of physics list you are using? Also I remember that the B3 example kills the neutrons in the secondary particles, did you take this into account when you did the experiment?

in B3, we kill neutrinos, not neutrons !

Hello @maire do you know the answers to my questions please?