Hi Michel,
I managed to solve the issue I was previously having and the spectrum appears to shows accurate photopeaks. However, I would also like to include the Compton background in the gamma spectrum histogram. Do you know if this is possible to do this using the built in histograms in rdecay01 or does it just produce the photopeaks?
I have also plotted the gamma spectrum using the UI commands (defined binning, primitive scorer, and dumping the scored data to a txt file) to get the following results.
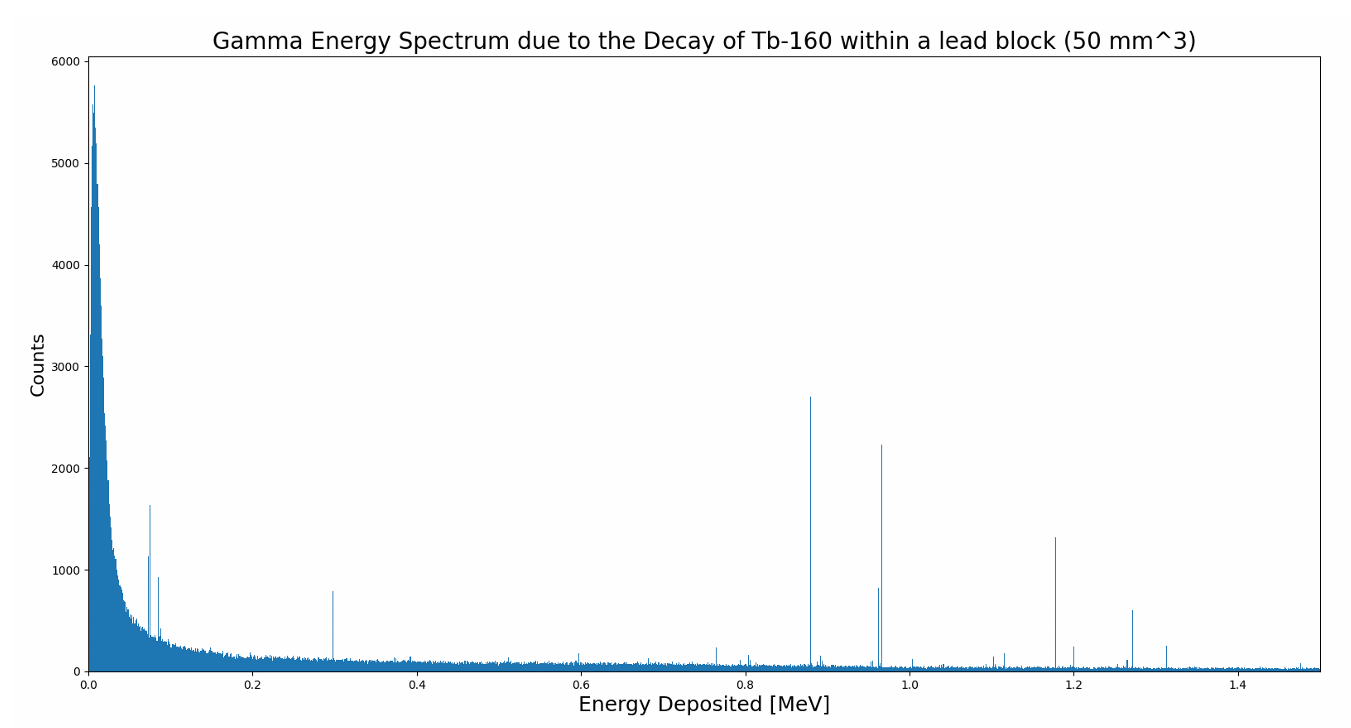
The large lower energy peak appear to be x-rays due to the lead and Tb160.
Thanks,
Jason.