Geant4 Version : 11
Operating System : Linux
Compiler/Version : 11.4.0
CMake Version : 3.22.1
Hello dear experts.
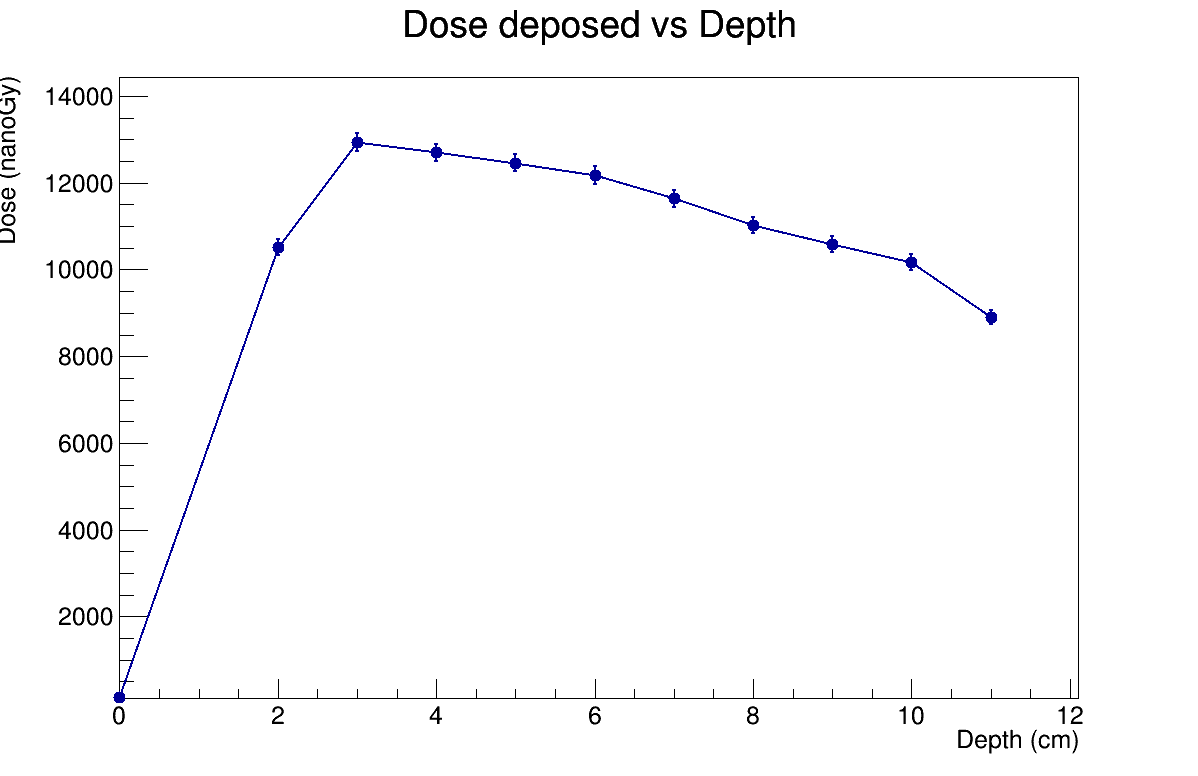
I need to score the dose deposited in my detector at different depths (10cm) in my water phantom. I am using the B1 example with some modifications and included the physics lists (RegisterPhysics(new G4EmStandardPhysics_option4(verb)) to obtain the results, but the plot I get is different from the usual PDD curve.
I use a gamma cone beam 6*MeV monoenergetic (in the form of a disc in the target ) with DSD = 100cm.
I don’t know what the problem is.
I would appreciate any suggestions.
Hi Ihssane
I’m not an expert in this area, but if I Google “PDD curve” I see graphs pretty much like yours.
What are you expecting to see and why do you think yours is wrong?
John
Thank you, Mr. Allison, for your answer.
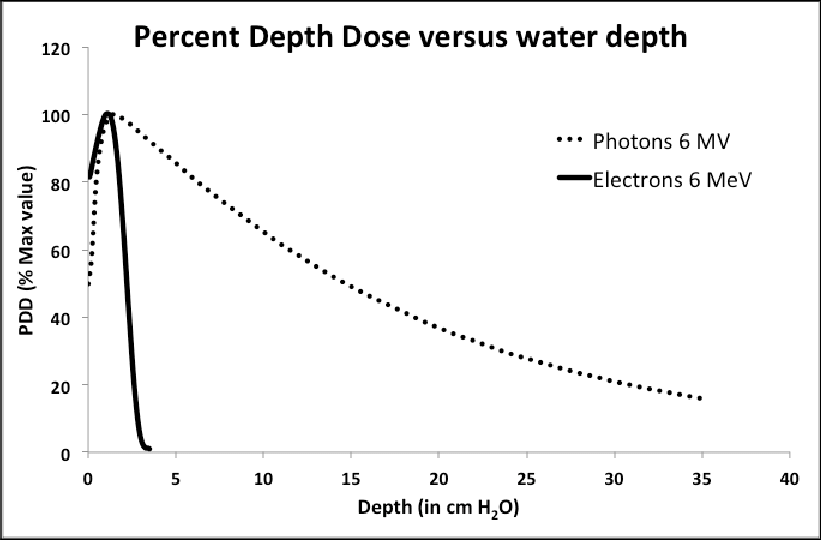
My problem is that I don’t observe the expected dose fall-off within the first few centimeters, as is normally seen in the depth–dose curve of 6 MeV photons.
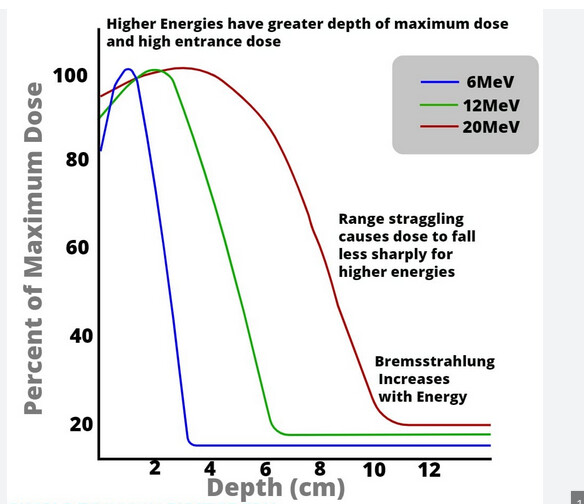
6 MeV refers to electrons in that plot. The “e” gives that away since electrons must (and can) be accelerated by external voltages unlike photons. Also Brehmsstrallung losses are generally always worst for electrons. Example plot from here: