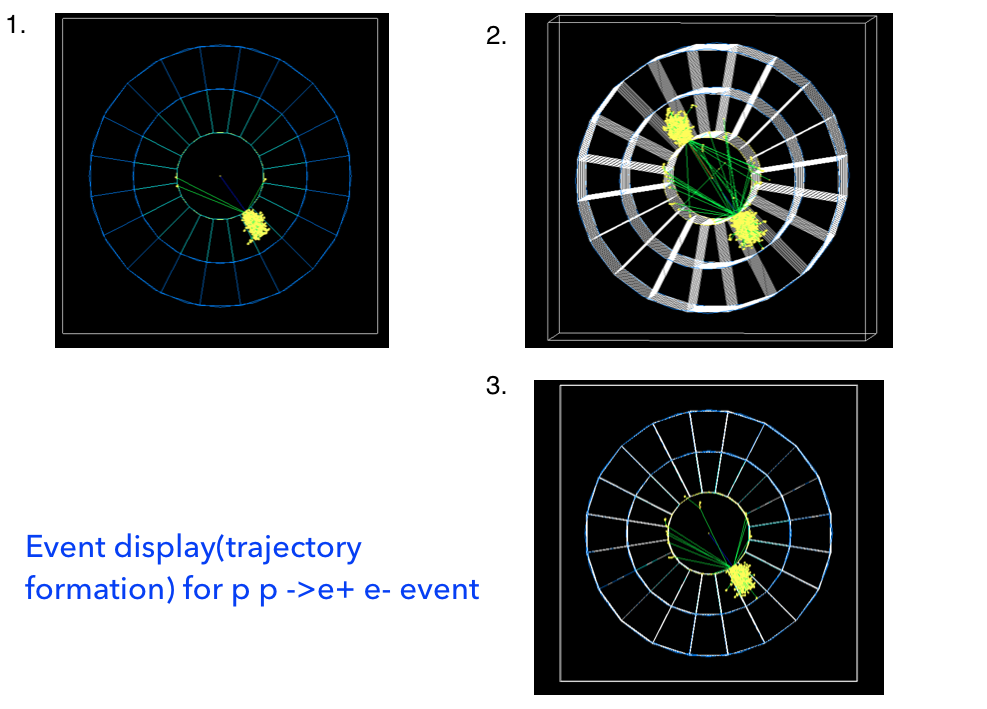
An input event(pythia) contains two back-to-back e+ and e- particles generated from pp collision. While visualizing the tracks/showers in OpenGl, I have noticed that in the final step(step 3 in the image) only one trajectory is visible even though in the inter-mediate (in step 2) level both of the showers are formed.
Can anyone please suggest what can be the possible reason for this?
Well…It’s very unlikely to be a flaw in the visualisation system. But is it a possibility that the electron or positron simply escapes along the the axis or through some gaps in the detectors and materials?
What energy pp? p or anti-p?
Where is the interaction point? I don’t see the source on your images. In fact, I don’t see e+ nor e- tracks - have you suppressed charged tracks?
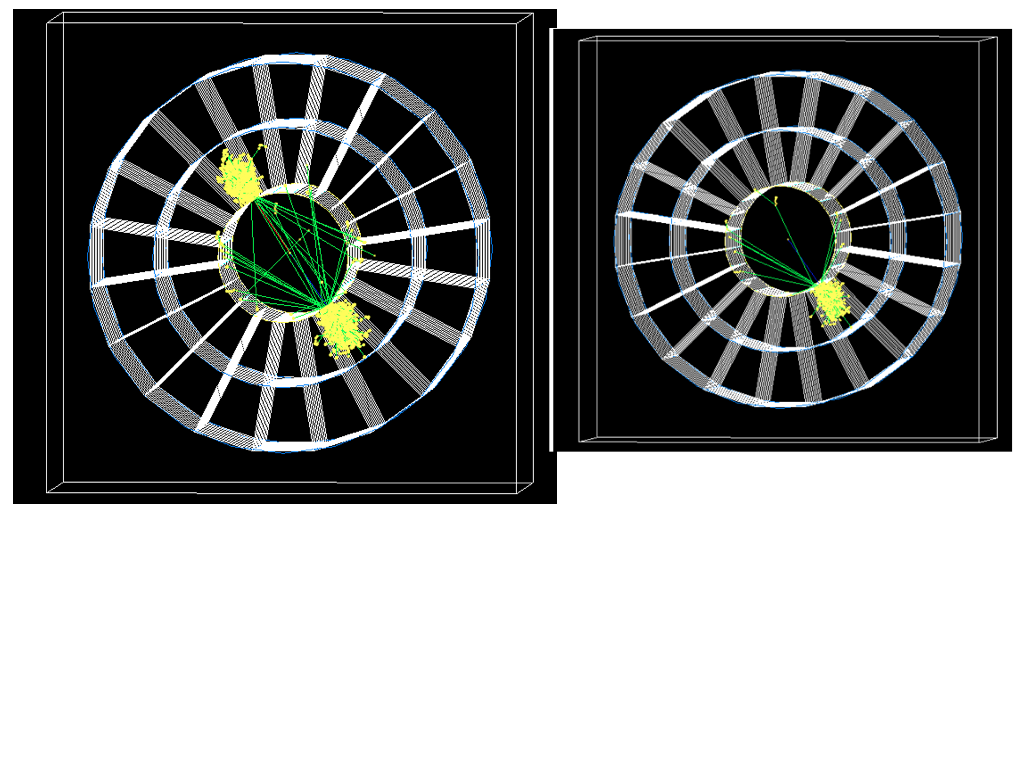
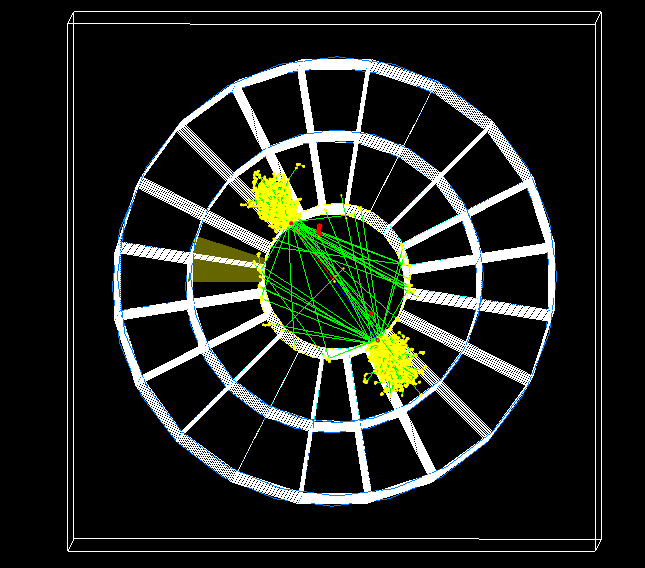
The images I sent earlier are the sequence in which I can see them on the screen but could not capture in a movie(having issues to install mpeg_encode). So, the 2nd step I created by changing px value of e- of the above event for illustration purpose only:
The error is most probably due to some issues in my coding(not able to figure out) but any flaw of the visualization system. Attached is a zoomed version of the images where two particles(in blue and red color) are visible. I can assure you that this is how I can see them formed.
I’ve been thinking about this. I think you may have hit the “display list limit”. Is there a message to this effect in your output?
********************* WARNING! **********************
*** Display list limit reached in OpenGL.**
*** Continuing drawing WITHOUT STORING. Scene only partially refreshable.**
*** Current limit: 50000 primitives. Change with "/vis/ogl/set/displayListLimit".**
*******************************************************
Increase the limit to, say, 1000000, or even 10x this if you have plenty of memory. (Perhaps we ought to increase the default value nowadays.)
/vis/ogl/set/displayListLimit 1000000
How this works is: the vis system draws all the trajectories, so you see the full event. But, if you are using OpenGL (OGLSX or equivalent) it only stores them in its internal graphics database (display lists) up to the limit. At the end of event or run, the vis system redraws the event to take account of depth information, transparency, etc., but it can only draw what’s in the display lists. Using display lists gives maximum graphics performance (rotation, zoom, etc.).
Another workaround is to use “immediate mode”, whereby it goes back into the G4 event to do the redrawing:
/vis/open OGLI
Another parameter can be tweaked with /vis/ogl/flushAt - see guidance help /vis/ogl/flushAt. OpenGL buffers its graphics primitives for performance.
Total energy deposition in this Event : 91.9681 (GeV)
********************* WARNING! ********************
*  Display list limit reached in OpenGL.
*  Continuing drawing WITHOUT STORING. Scene only partially refreshable.
*  Current limit: 50000.  Change with "/vis/ogl/set/displayListLimit".
***************************************************
I have been trying to solve this for many days… Will confirm the outcome after changing the limit.