Unexpected Neutron Spectrum from proton beam

Dear all,
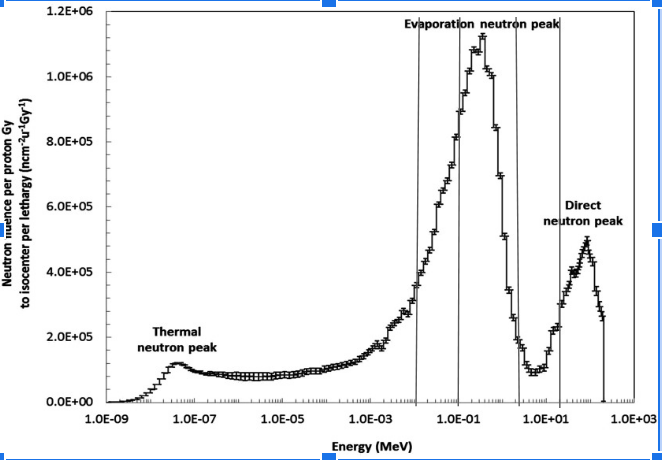
I am beginner at Geant. I am simulating a beam of 250MeV protons hitting a water phantum, and I get the energy spectrum of the neutrons that are produced. I expect to get the following plot with three peaks:

Screenshot%20from%202020-01-02%2021-36-38

However I get this result:

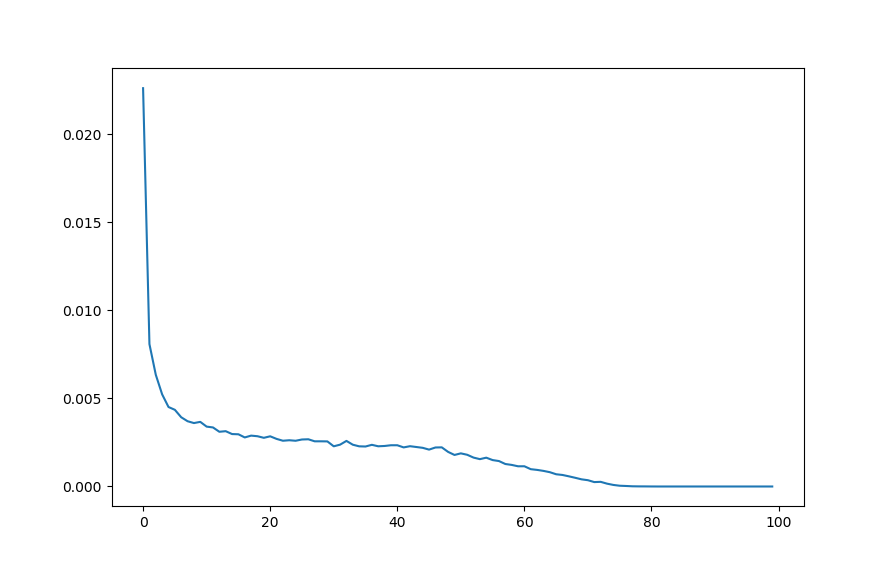
Does this look correct? I am wondering if I am making any mistake during the recording phase.
Thanks in advance.

Good morning! The reference results are shown as a lethargy plot, so in order to compare them to your results you should first plot the Geant4 output in an equivalent “lethargy” format.

Specifically, a logarithmic binning on the X (energy) axis, and on the Y axis the differential neutron flux, multiplied by the (mid) energy of the bin.