I built an electromagnetic calorimeter with LYSO crystals in Geant4.
When I simulated my detector with 100 keV photon, I encountered an issue: the different response functions for 10.5.p01 and 10.6.p02 showed up for the same photon energy.
I want to know what changed in EM physics or other things in 10.6.
First off, I made a 5 * 5 * 55 mm^3 LYSO crystal and then wrap with aluminum foil.
I attached SiPM’s to both ends of the crystal.
I formed a 30 x 30 matrix with these crystals.
The thickness of SiPM is 0.3mm, and the area is 5 x 5 mm^2 which is the same as the area of the LYSO.
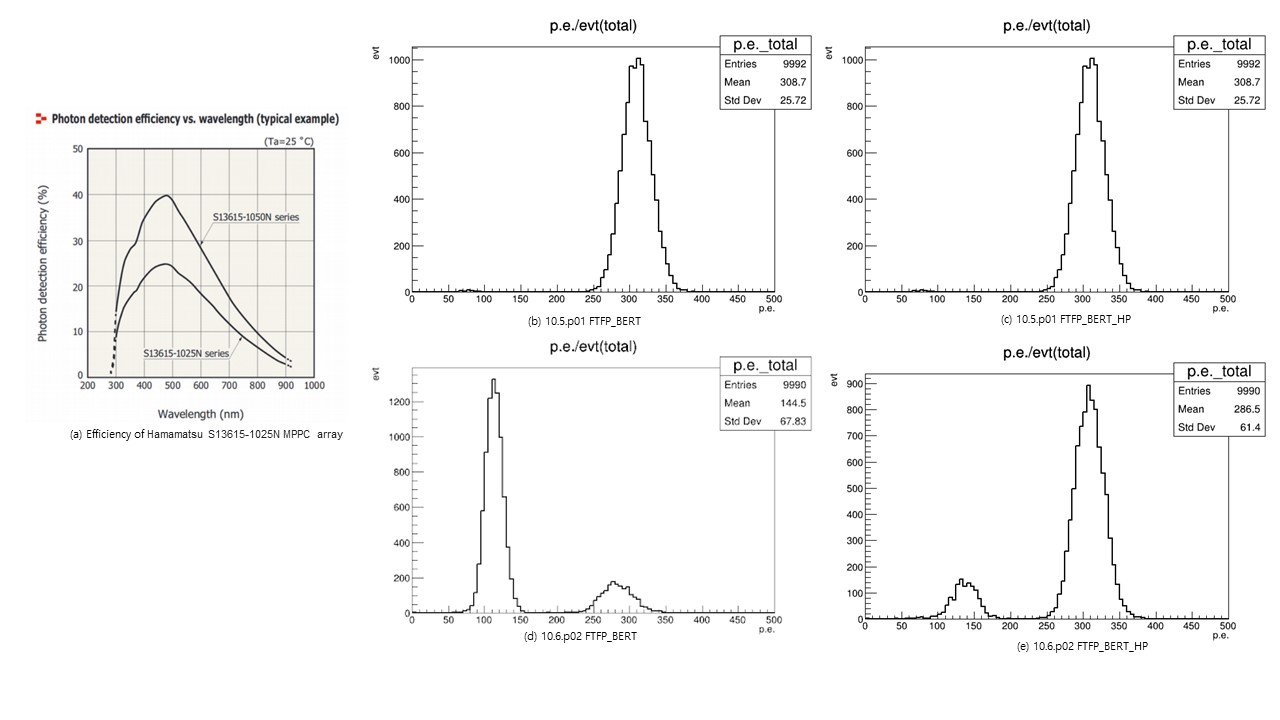
And I set the photon detection efficiency of the SiPM with Hamamatsu S13615-1025N MPPC array as the figure (a).
I sent 0.1 MeV photons to the center of the crystal. The photon beam direction was perpendicular to the 55 mm side.
My simulations were done with two geant4 versions & two physics lists.
Geant4 versions: 10.5.p01, 10.6.p02
Physics lists: FTFP_BERT, FTFP_BERT_HP
I draw the distributions for # of photoelectrons.
We got four distributions for four simulation cases:
In 10.5.p01, the results of FTFP_BERT & FTFP_BERT_HP are the same.
However, for 10.6.p02, FTFP_BERT & FTFP_BERT_HP resulted in the different response functions.
In addition, we can see the different distributions for 10.5.p01 and 10.6.p02.
I am very curious and want to figure out why we obtained different distributions between 10.5 and 10.6, and between FTFP_BERT and FTFP_BERT_HP in 10.6.
Which version and physics list describe the real world better than the others?
for 100 KeV gamma primary the difference in response for FTFP_BERT and FTFP_BERT_HP should be small. What you see in 10.6 cannot be correct. Why this happens - not clear, the problem may be not only in physics or transportation but also somewhere in the analysis chain. For any case, please, post material description of LISO.
Is there any difference in the photoelectric effect? Because when I print out physical process of several events, the secondary of photoelectric effect is quite different. In 10.6.p02 & FTFP_BERT, the secondary is only one electron. But in 10.6.p02 & FTFP_BERT_HP, the secondaries are a few electrons.
I’m confused as to the role of optical processes here. In the first post, you show plots of the number of electrons produced by the photoelectric effect (what is the x axis?). Is it true that this occurs prior to any optical photon generation, and thus the optical material properties aren’t relevant? If so could you please post the composition and density of LYSO?
I’m sorry to make confused. In first post, x-axis of the distribution is number of photoelectrons as optical photon detected by sipm.
And in second post, I referred photoelectric effect that occurred in LYSO crystal, it generated electron and electron generated optical photon by physics process.
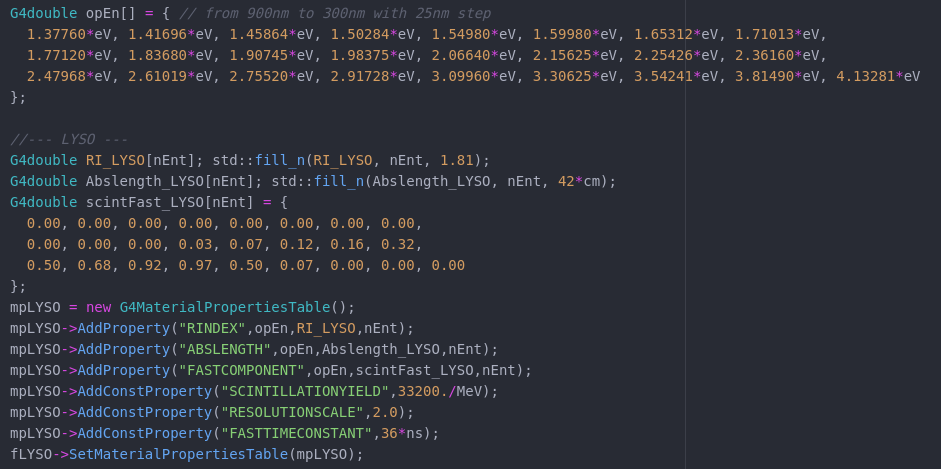
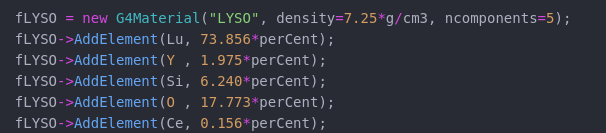
And here it is composition and density of LYSO crystal
It may be related to a bug in scintillation in 10.6 where scintillation due to neutral particles was neglected. Could you please try 10.7.patch3.
However, I don’t see how that would produce what you see. You may need to try to decouple the electron production from the optical photon production. You could use a UserSteppingAction. Also try the same physics and materials in example extended/optical/OpNovice2.
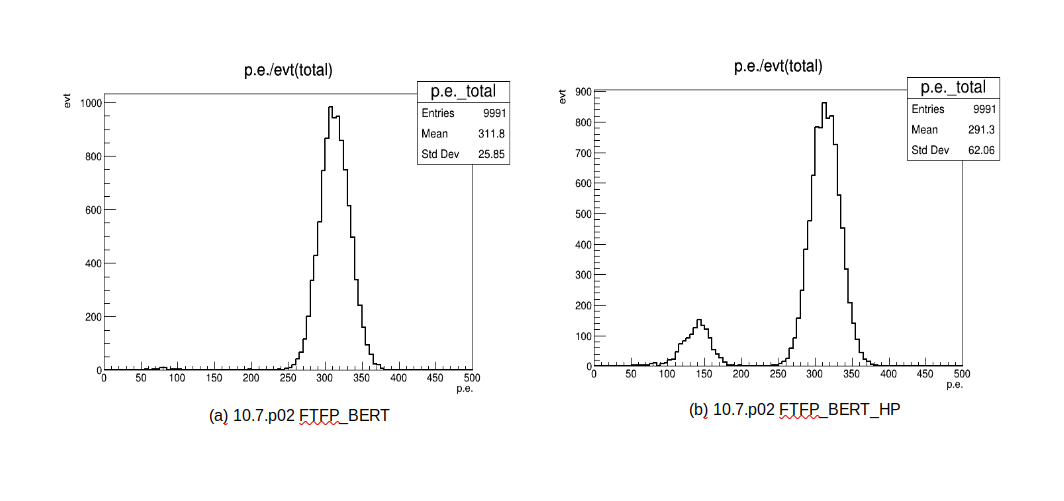
I try with 10.7.p02 which is latest version of my workspace. I simulated with same configuration of first posting. And I also use two physics lists; FTFP_BERT, FTFP_BERT_HP.
so the below picture is a result.
please, note that when HP is used automatically radioactive decay module and atomic de-excitation module are enabled. I do not know which of these two is responsible for this peak.
You may check if enable first fluorescence and Auger electron production on top of FTFP_BERT via UI commands.
After you may add G4RadioactiveDecayPhysics on top of FTFP_BERT.
From examination of the plots, the lower peak is at roughly 44 keV if the upper is at 100 keV. The difference in peaks is roughly 56 keV. The Kalpha line in Lu is at about 63 keV, so the K-alpha escape should be at roughly 37 keV. So likely the lower peak is the Kalpha X-ray escape peak, visible because the scintillator is small and fluorescence and Auger electron production are enabled.