Hello!
I work on microyz. I want to check that the steps of visualization are true, please.
1- write
sarahabdelaziz@Sarahs-MacBook-Pro microyz-build % ./microyz microyz.in
....
========================================================================================
--> G4TaskRunManager::CreateAndStartWorkers() --> Creating 5 tasks with 1 events/task...
========================================================================================

G4WT5 > ### Run 0 starts on worker thread 5.
G4WT5 > ... set ntuple merging row mode : row-wise - done
G4WT5 > --> Event 0 starts with initial seeds (13049039,61775110).
G4WT7 > ### Run 0 starts on worker thread 7.
G4WT7 > ... set ntuple merging row mode : row-wise - done
G4WT6 > ### Run 0 starts on worker thread 6.
G4WT6 > ... set ntuple merging row mode : row-wise - done
G4WT3 > ### Run 0 starts on worker thread 3.
G4WT3 > ... set ntuple merging row mode : row-wise - done
G4WT2 > ### Run 0 starts on worker thread 2.
G4WT2 > ... set ntuple merging row mode : row-wise - done
... write file : yz.root - done
... close file : yz.root - done
Graphics systems deleted.
Visualization Manager deleting...
2- then open plot.C by
sarahabdelaziz@Sarahs-MacBook-Pro microyz-build % root plot.C
...
root [0]
Processing plot.C...
**** Results ****

---> yF =7.65877 keV/um
---> yD =8.59941 keV/um

---> Limits:
     * min value of y = 4.86869 keV/um
     * max value of y = 12.0757 keV/um
root [1] 2025-01-01 14:44:38.466 root.exe[18663:3624054] +[IMKClient subclass]: chose IMKClient_Modern
2025-01-01 14:44:38.466 root.exe[18663:3624054] +[IMKInputSession subclass]: chose IMKInputSession_Modern
And I got the histogram.
3- to visualize
sarahabdelaziz@Sarahs-MacBook-Pro microyz-build % ./microyz
Available UI session types: [ Qt, tcsh, csh ]

**************************************************************
 Geant4 version Name: geant4-11-03 [MT]   (6-December-2024)
  << in Multi-threaded mode >>
                       Copyright : Geant4 Collaboration
                      References : NIM A 506 (2003), 250-303
                                 : IEEE-TNS 53 (2006), 270-278
                                 : NIM A 835 (2016), 186-225
                             WWW : http://geant4.org/
**************************************************************
.....
Computed tolerance = 6.4e-06 nm

---------------------------------------------------------
---> The tracking cut is set to 11 eV
---> The maximum step size is set to 5.82593e+288 pc
---> The TrackerSD radius is set to 0 fm

---------------------------------------------------------
World_LV is registered to the default region.
physicsList->Construct() start.
physicsList->CheckParticleList() start.
physicsList->setCut() start.
/run/physicsModified
I want to visualize the data from the microyz.in, In here The TrackerSD radius is set to 0 fm , but the default value in the code is 2 nm. So, how can I let it to visualize mcaro file (microyz.in)?
When the Idel prompt is opened I write
/control/execute/ vis.mac
When I write
/control/execute microyz.in
I got
***** Batch is interrupted!! *****

-------- WWWW ------- G4Exception-START -------- WWWW -------
*** G4Exception : UIMAN0123
      issued by : G4UImanager::ApplyCommand
Command aborted (200)
Error code : 200
*** This is just a warning message. ***
-------- WWWW -------- G4Exception-END --------- WWWW -------

illegal application state -- command refused:"/control/execute microyz.in"
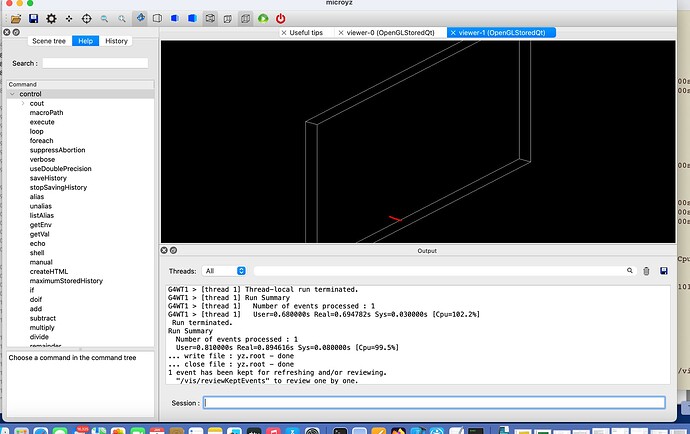
I attached the photo, which has a red line, what dose this mean, please?
Happy New Year!
