I’m developing a generator that randomly samples points in an arbitrary solid. I would like to be able to visualize the 3D distribution of such points along with the implemented geometry, for debugging purposes.
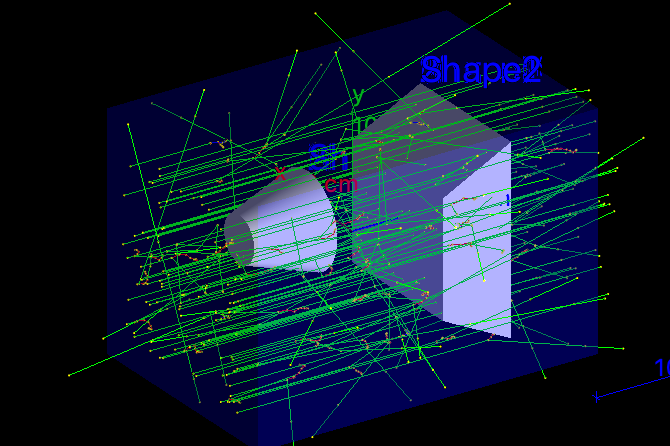
I was able to start particles from the points and visualize trajectories, as described in the manual. This helps a bit, but I was wondering whether there is any trick to only draw the starting point. I could not find anything helpful in the forum and on the manual.
If the answer is negative, I guess I can always save the (x, y, z) triples on disk at runtime and try to plot them with some other toolkit (e.g. ROOT).
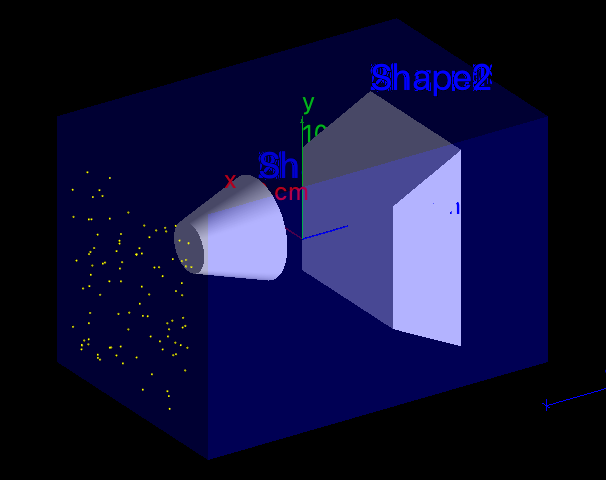
The short answer is: yes, it is possible. I didn’t do it myself, but there are several examples where you can see such possibility. For example you can visualise your geometry as a cloud of points: