_Geant4 Version: v11.2.1
_Operating System: AlmaLinux-9
_Compiler/Version: gcc (GCC) 11.4.1 20231218 (Red Hat 11.4.1-3)
_CMake Version: 3.26.4
Here’s the English translation of your text:
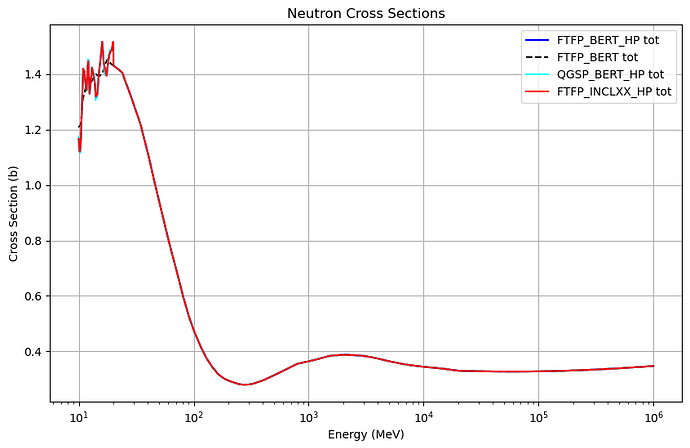
I am using the Hadr00 example from the extended directory of Geant4 to obtain cross section data. My goal is to get the cross section of neutrons (from 10 MeV to 1 TeV) incident on natural carbon, using different physics lists. The physics lists I am using are:
a. FTFP_BERT
b. FTFP_BERT_HP
c. FTFP_INCLXX_HP
d. QGSP_BERT_HP
However, I noticed that in the high-energy region, the cross section curves of these physics lists are identical. I’m not sure why this is the case. If anyone has experience with this, I would really appreciate your help. Thank you!
If you’d like this polished further for a forum or paper, let me know!
The following is my relevant information:
1. Contents of mac files:
Command: ./Hadr00 nc.mac FTFP_BERT_HP
#================================================
#     Macro file for hadr01
#     06.06.2006 V.Ivanchneko
#================================================
/control/verbose 1
/run/verbose 1
/tracking/verbose 0
#
/testhadr/TargetMat        G4_C
/testhadr/targetElm        C
/testhadr/TargetRadius     1  cm
/testhadr/TargetLength     1 cm
/run/printProgress         10
/testhadr/nBinsE      10000
/testhadr/minEnergy   10 MeV
/testhadr/maxEnergy   1 TeV

#
/run/initialize
/process/em/workerVerbose 0

/testhadr/verbose 0
/testhadr/targetElm  C
/testhadr/fileName  ./output/FTFP_BERT_HP
/run/beamOn 1
#
2. Python script for reading cross - sections in the output root file
def extract_th1d_to_dataframe(file_path, hist_name, to_linear_energy=True, plot=False, save_csv=True, output_path="xs_output.csv"):
    """
    Extracts data from a TH1D histogram in a ROOT file and returns a DataFrame
    containing energy and cross section values. Optionally, the data can be
    saved as a plain text file without column names or index.

    Parameters:
        file_path (str): Path to the ROOT file.
        hist_name (str): Name of the histogram (e.g., 'h2').
        to_linear_energy (bool): Whether to convert the x-axis from log10(E/MeV) to E (MeV).
        plot (bool): Whether to plot the data.
        save_csv (bool): Whether to save the data as a CSV file (only two columns: energy and cross section).
        output_path (str): Path to save the output file (default is "xs_output.csv").

    Returns:
        df (DataFrame): A DataFrame containing the energy and cross section values.
    """
    # Open the ROOT file
    file = ROOT.TFile.Open(file_path)
    if not file or file.IsZombie():
        raise IOError(f"Failed to open file: {file_path}")

    hist = file.Get(hist_name)
    if not hist:
        raise ValueError(f"Histogram not found: {hist_name}")

    # Extract bin data
    n_bins = hist.GetNbinsX()
    x = np.array([hist.GetBinCenter(i) for i in range(1, n_bins + 1)])
    y = np.array([hist.GetBinContent(i) for i in range(1, n_bins + 1)])

    # Convert x-axis to linear energy if requested
    energy = 10 ** x if to_linear_energy else x

    # Create a DataFrame with two columns
    df = pd.DataFrame({
        "x": energy,
        "y": y
    })

    # Plot if requested
    if plot:
        plt.figure(figsize=(8, 6))
        plt.plot(energy, y, '-', lw=1.5, label=hist.GetTitle())
        plt.xscale('log')  # Set x-axis to logarithmic scale
        plt.xlabel("E (MeV)" if to_linear_energy else "log₁₀(E / MeV)", fontsize=12)
        plt.ylabel("Cross Section (barn)", fontsize=12)
        plt.title(hist.GetTitle(), fontsize=14)
        plt.grid(True, which='both', ls='--', alpha=0.5)
        plt.legend(fontsize=10)
        plt.tight_layout()
        plt.show()

    # Save to CSV if requested
    if save_csv:
        df.to_csv(output_path, index=False, header=False)
        print(f"✅ Cross section data saved to: {output_path}")

    return df
