Hi Dr Vladimir Ivantchenko and everyone,
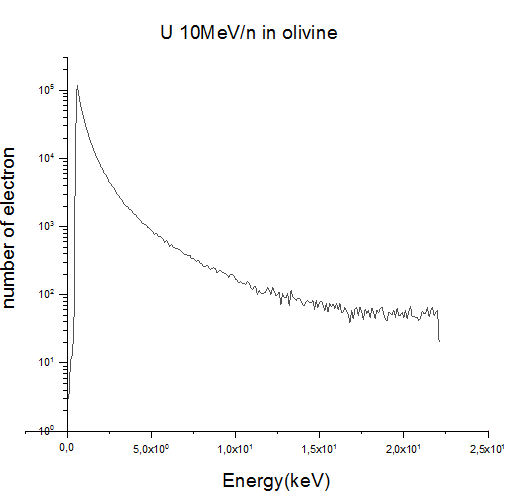
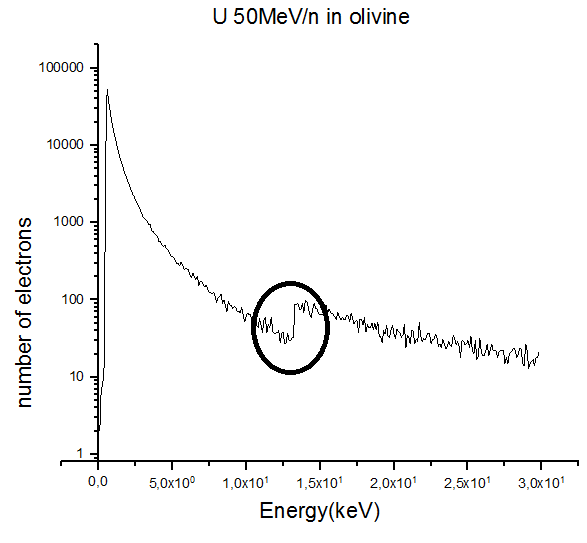
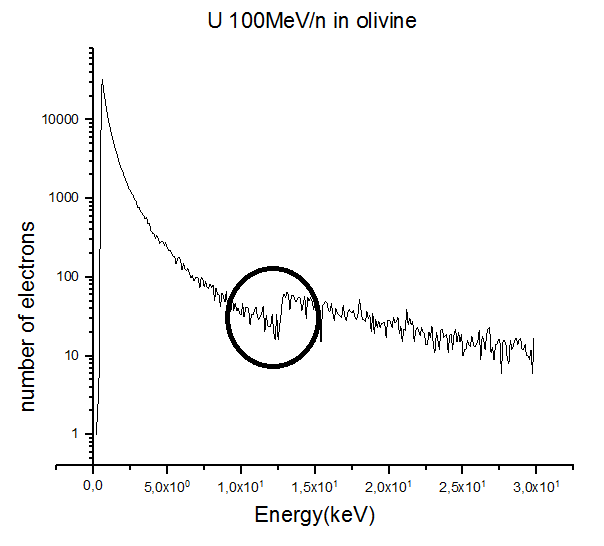
Now I’m studying Uranium passing through in Olivine crystal in geant4 with energy of 10MeV/n ,50MeV/n and 100MeV/n. and with the Origin software I make the graph of number of electrons depend on the energies.
I used codes in physicslist.cc
void PhysicsList::SetCuts()
{
if (verboseLevel>0)
{ G4cout<< “PhysicsList::SetCuts;”;
G4cout << "CutLength : " <<G4BestUnit(defaulfCutValue,“Length”) << G4endl;
G4ProductionCutsTable :: GetProductionCutsTable()->
SetEnergyRange(10.*eV,1.*GeV); // SetEnergyRange(lowedge,highedge);
SetCutValue(fCutForGamma, “gamma”);
SetCutValue(fCutForElectron, " e-");
SetCutValue(fCutForPositron, “e+”);
SetCutValue(fCutForProton, “Proton”);
if (verboseLevel>0){DumpCutValuesTable(); }
}
and I already tried to change the value in lowedge SetEnergyRange - 100eV,50eV,10eV and highedge is not change ( 1 GeV).
So I got the graph in below:
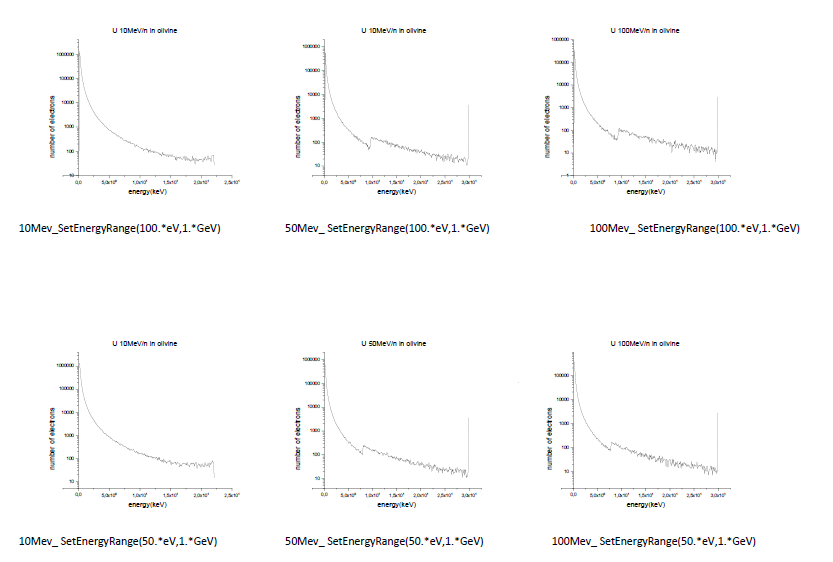
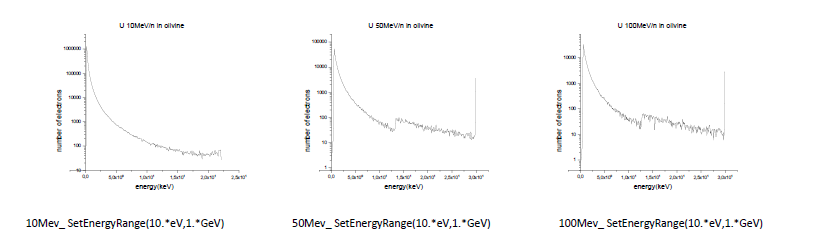
In the graph of 10MeV/n is ok but for 50MeV/n and 100 MeV/n the middle of graph was jumped. why?I think that according to the process of physics , the graph will be slowing down .right? Why suddenly in the middle of graph is jump double times? It is because of geant4 software or something ??
with best regards,
Than