_Geant4 Version:_11.2
_Operating System:_Linux
Dear friends,
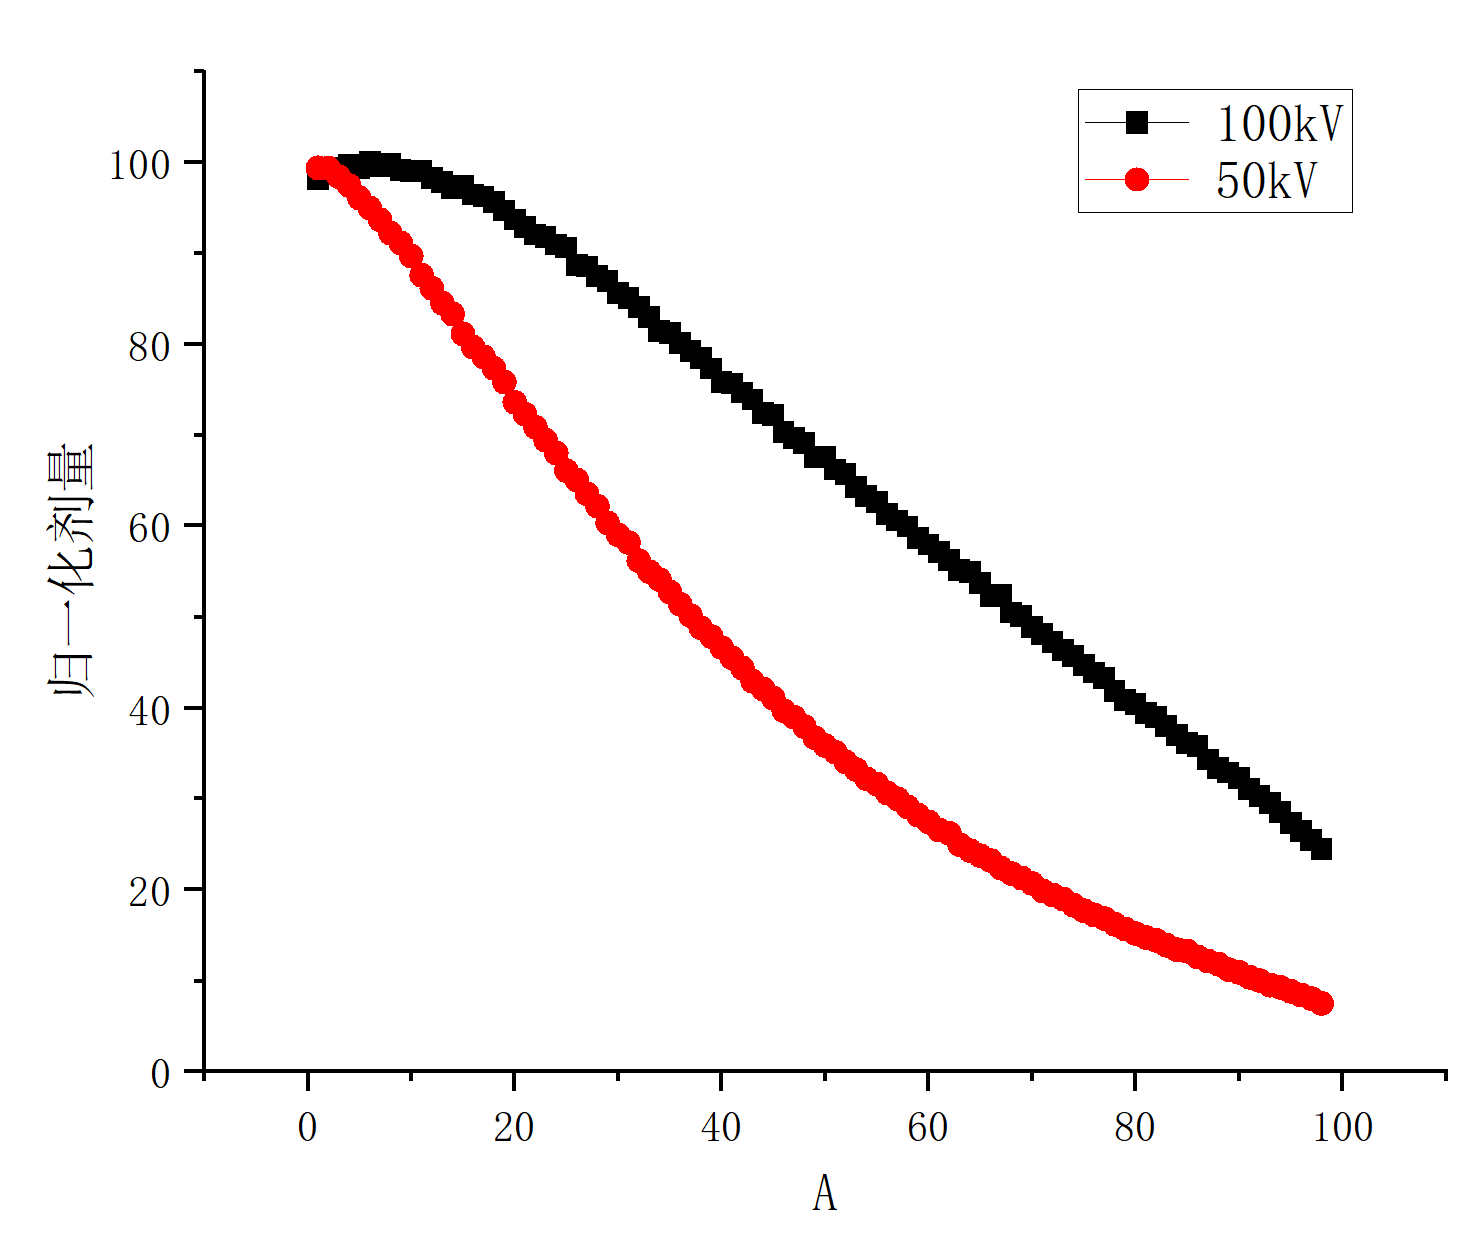
I want to calculate the dose deposition curve of x-ray in water using the example of TestEm7, but the results I calculated is not match the experimental data. The results as follows:
I have the following two questions:
Firstly, why does the 100kV curve have a rising edge at the front end?
Secondly, why the decay rate of the curve is less than the experimental value?
Best wishes.
Hi,
I do not see the exp data in the plot. In addition, which spectrum is this one? is it from a phase space file of a specific LINAC?
Cheers
Susanna
Dear friend,
The vertical axis of this graph represents the normalized dose, I directly chose to use a 65kV photon incident into the water to represent the energy deposition of a 100kV photon.
Thanks for your reply.
If I understand correctly you use 65 keV photons, which is probably the average energy of a 100 KV beam. Correct? then, where are the exp data?
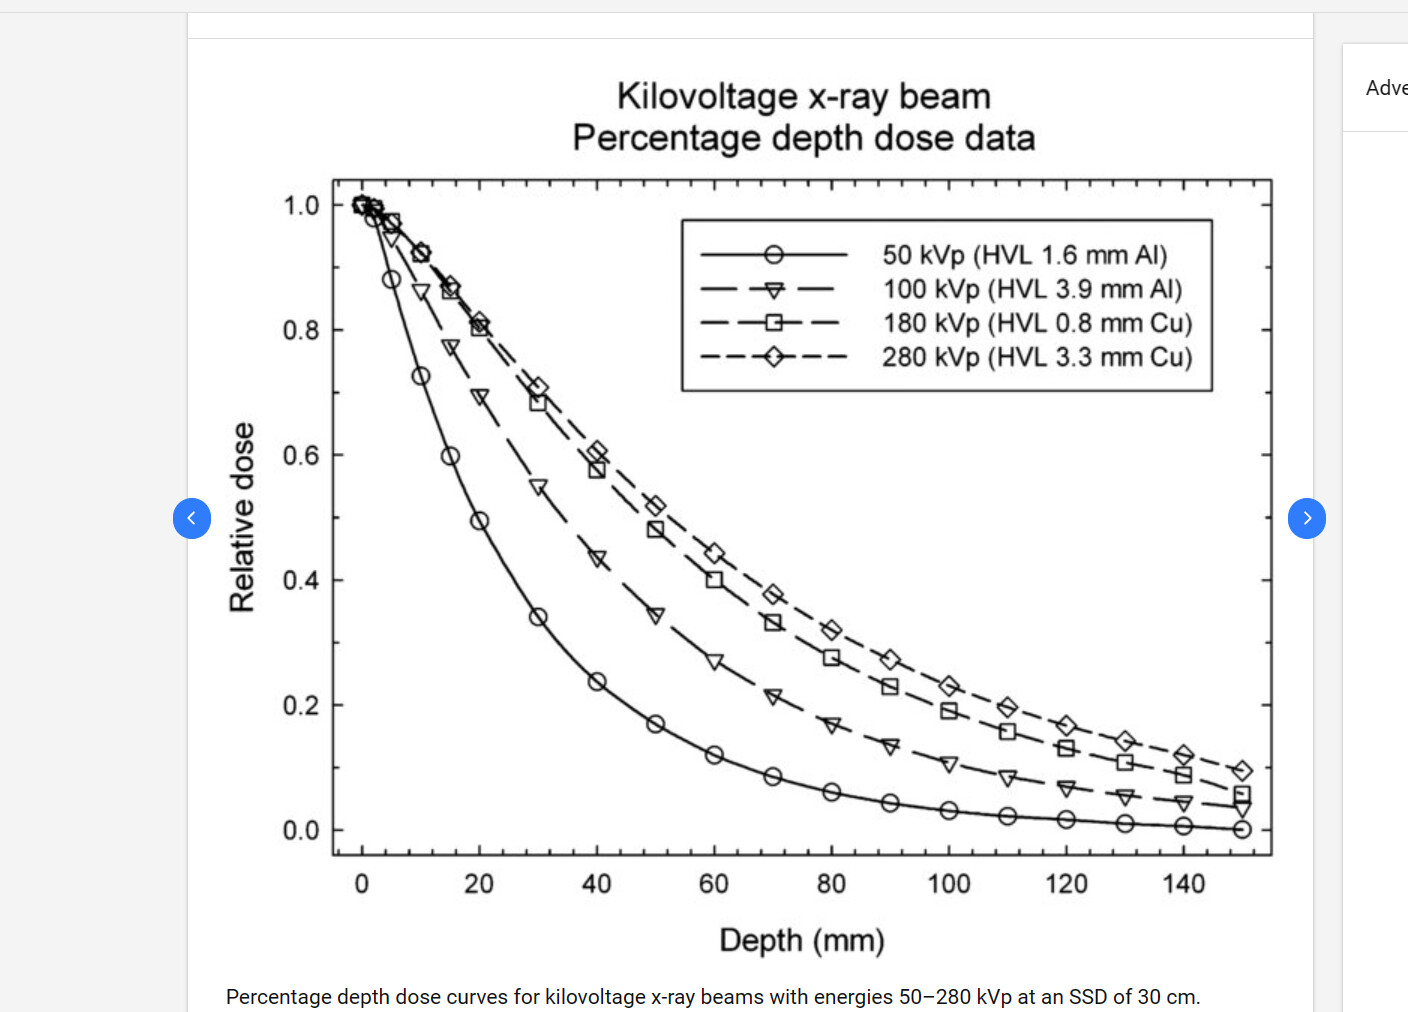
Yes, you are right. The exp data as follows: