I have Geant4 10.7 installed, in a Ubuntu 18.04.6 system, compiled using gcc 7.5.
I’m trying to simulate the gamma emission via neutron activation, I run the example in extended/radiaoctivedecay/Activation, using Co as a target. I simply compiled and run the code, using the mac file Co.mac, without hanging anything.
The G4NDL data are installed (if I remember correctly, I used the command
-DGEANT4_INSTALL_DATA=ON
in the installation process.
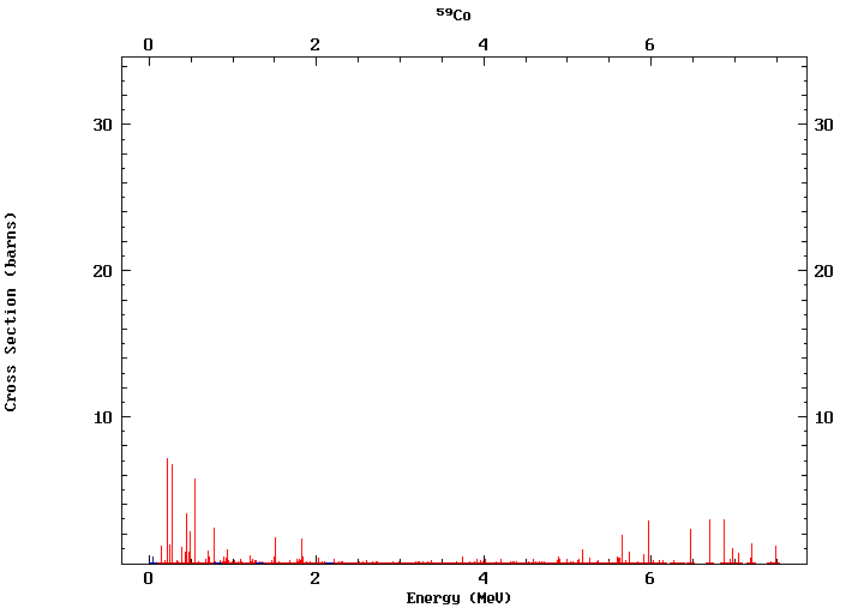
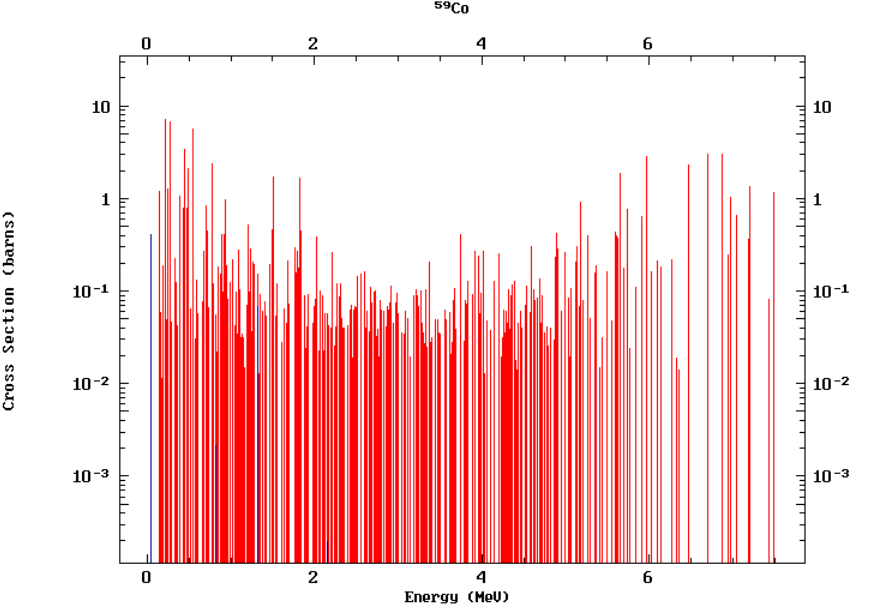
My problem is that the output is not consistent at all with what I found in the database. Here you can see the gamma lines i got from the IAEA website (same plot, log and linear scale)
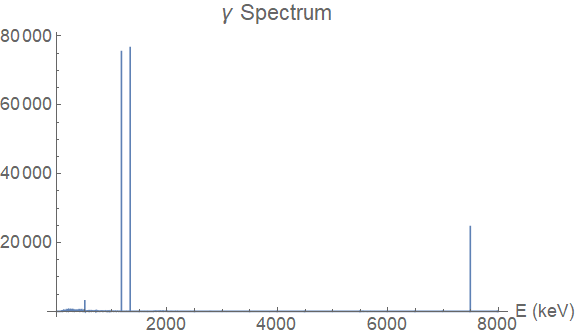
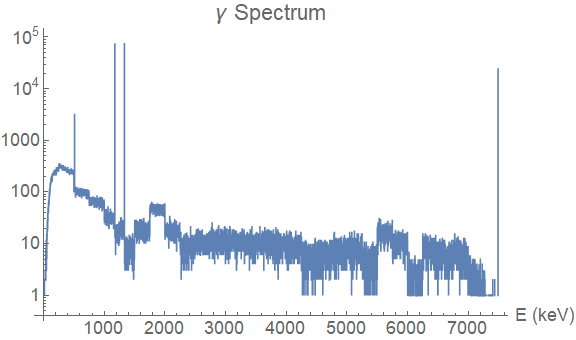
These are completely different, in particular, even disregarding the continuous part of the spectrum (which… I’m not sure if it’s physical to be honest…), most of the peaks are not present, and most of the gamma’s seem to be emitted at maximum energy, ~7.5 MeV (I’m guessing the peaks at ~1.5 MeV are resonances and they are not gamma’s produced via neutron capture). This is even clearer looking at the plots in linear scale: there are some peaks at ~6.8 MeV, even more intense than the one at 7.5, which are completely missing.
Am I doing something wrong? Did someone else had similar results? Thank you very much for your help!
I have some experience in calculating cross-section. However, here I can provide you some information.
What I realize that if you see IAEA graphs they are cross-section (barns) Vs Energy. Whereas your histogram is #entries Vs Energy (MeV) ? Right ?
README
Histogram #14 provides information on the Rate in unit Bq. What you need to do; take this information on the decay rate of the gammas and convert all #entries into cross-section.
What I realize that if you see IAEA graphs they are cross-section (barns) Vs Energy. Whereas your histogram is #entries Vs Energy (MeV) ? Right ?
Yes, that’s correct, however the problem is NOT that the numbers in the two plots are different, but that the shape is clearly different, i.e. in th database there are a lot of peaks that are not present in the simulations.
I cannot see how going from entries to cross section could change the shape…
Moreover, histogram #14 gives the time distribution of the gamma emission, i.e. WHEN they are emitted (dN/dt), how this could change the energy spectrum of the gamma’s?
There are some problems with reproducing accurate thermal neutron capture gamma ray spectra for (n,gamma) reactions fir some isotopes when using the HP physics.
In short, agreement is is good for some nuclei and not for others with no obvious (to me) pattern. I’ve never checked out cobalt to see if it is one of the culprits. Playing with two of the NeutronHP physics UseOnlyPhotoEvaporation and DoNotAdjustFinalState can sometimes improve results.
2- in example Activation, you see in addition gammas of deexcitation of Ni60 excited states.
see also example rdecay01 : rdecay.mac emil-activ.mac.txt (395 Bytes) rdecay.mac.txt (271 Bytes)