This is a great help, thank you so much! All is running perfectly.
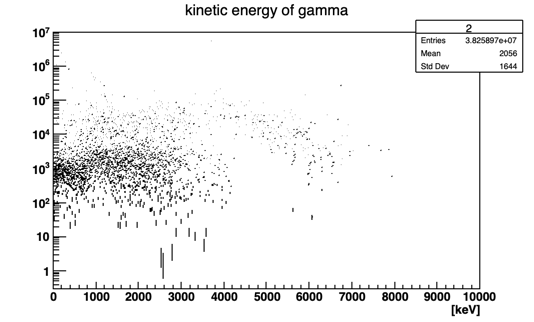
Forgive my ignorance, but I was wondering how you have made your gamma spectra above look like a spectrum. My histogram for kinetic energy of gamma rays just outputs individual points (below) - is there a way to draw this so it looks like a spectrum like yours do? This is probably a very basic question so sorry for that.
I uncomment the two lines in the .mac file (not needed if you are using the unmodified version of Hadr03.cc from the distribution):
/process/had/particle_hp/use_photo_evaporation true
/process/had/particle_hp/do_not_adjust_final_state true
I output a .ascii file with same name as the .root file (that’s what the /analysis/h1/setAscii 2 line in the macro does). I then use a separate Octave program (it should be able run under Matlab too) to plot the spectrum. I’ve attached that program as Read_Hadr03Ascii_Spectum_Plot.m.txt. To use it, remove the .txt extension, move it to the same directory as the .ascii file, gzip the .ascii file, change the path to the ascii input file in the .m program to match where it is on your computer. Then run the program under Octave.
Hi Luis,
I have a LibreOffice spreadsheet for 35Cl(n,gamma), 36Ar(n,gamma), 40Ar(n,gamma), 58Ni(n,gamma) comparing Geant4 simulation energy and intensity results to the NNDC data base. However, this forum does not support .ods files for uploading. Please let me know your email address and I will send it to you.
Hi @John_McFee John, you can use manzanilla+lapp_in2p3_fr, with “+”->“@” and “_” → “.”
Could you please include the exact settings for your simulation?
Thanks in advance!
Dear @John_McFee , I am also facing the same problems with neutron capture in liquid argon that have commented in previous posts. Would you mind to share with me your results in argon and the settings you’d recommend to use in order to get a good simulation of this process?
Thank you very much in advance
It seems the way Geant4 is using the NNDC database will produce in all scenarios gammas that are not supposed to be produced. The best you can do is place this in your mac file:
/process/had/particle_hp/use_photo_evaporation true
/process/had/particle_hp/do_not_adjust_final_state false
/process/had/particle_hp/skip_missing_isotopes true
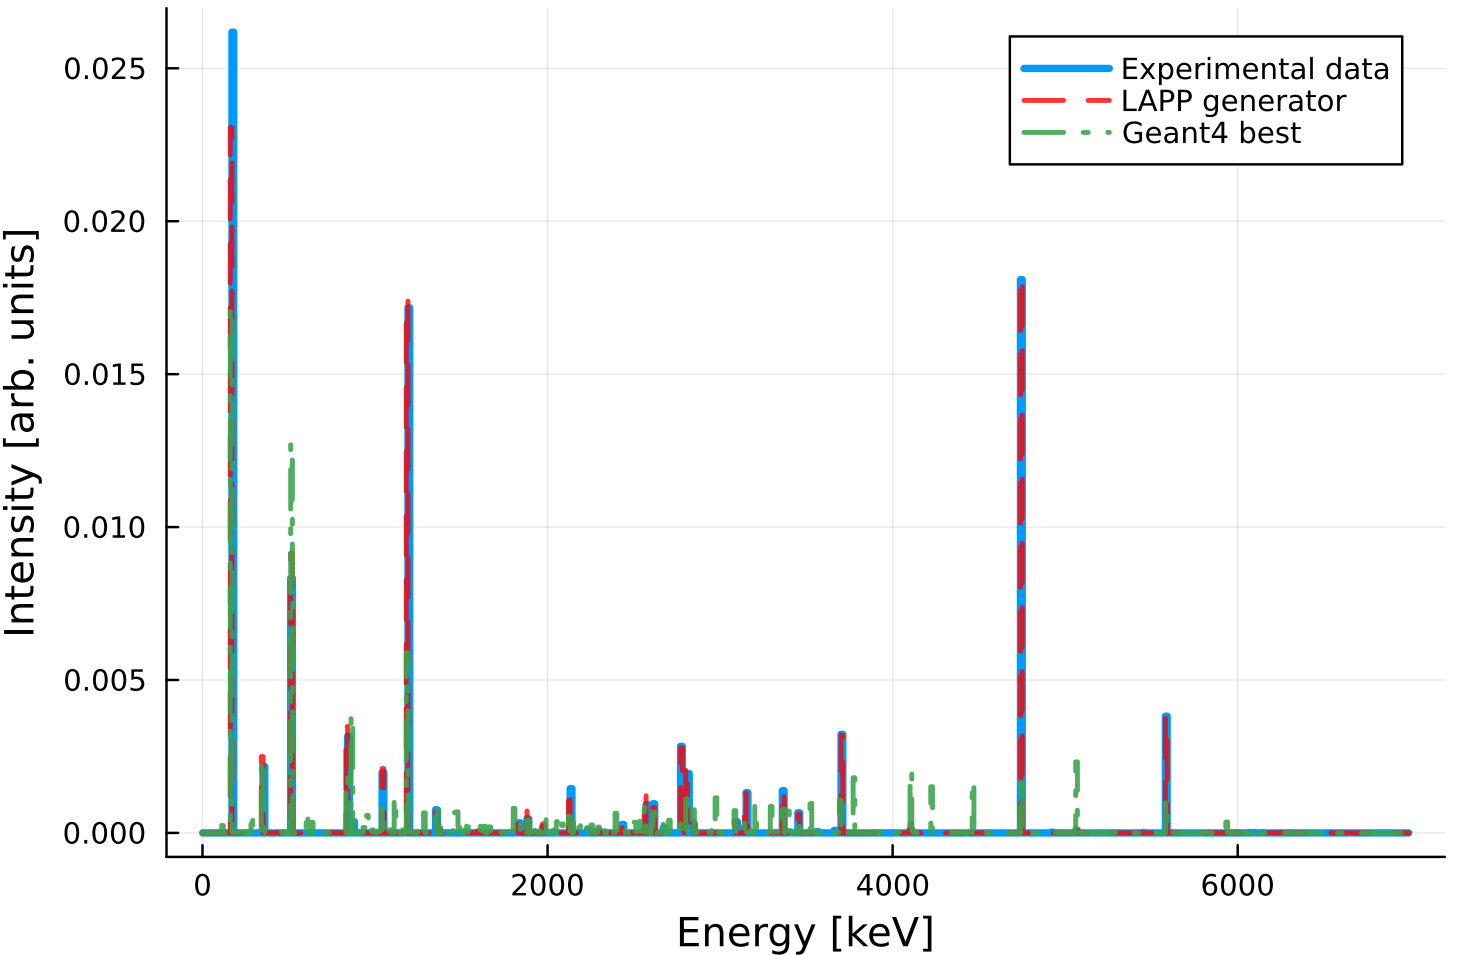
but the results will still be far from measured data. The solution that I implemented is creating my own generator of gammas from neutron capture on Argon. Another solution could be just edit the files that Geant4 will use but these files are used in other processes as well so I’m not sure is that is a good idea.
You can find the implementation I did here for Ar40 and Ar36:
Then I just call an faction in my primary generator action. With this I get a fair agreement with data
Hi @lmanzanillas , this is really useful. Thank you very much for sharing this information. I’ll keep working on the simulation and I’ll post any significant finding.
best,
Miguel